Abstract
Assessing quantitatively the microscopic pore structures of porous rocks, including irregularities of pore shapes and pore size distributions, is becoming one of the most challenging efforts. Nuclear magnetic resonance (NMR) measurements were used to provide insights into the pore geometry (pore size and shape) and pore connectivity of the Chang 7 tight shaly sandstones (in situ permeability <0.1 md) in Ordos basin. The incremental transverse relaxation time (T2) distributions for the 100% brine-saturated samples display unimodal and bimodal behaviors, presenting a geometrical arrangement composed of small to large pore size domains. The NMR parameters such as bulk volume irreducible (BVI) (capillary and clay-bound water), free fluid index (FFI) (movable water), the value of T2 separating the BVI from FFI, the amplitude weighted mean on a logarithmic scale (T2gm), and the value of T2 that shows the highest frequency on the T2 spectrum (T2peak) for each sample were determined. Then the fractal theory was adopted to quantitatively express the complexity and heterogeneity of the sandstones. The results show that only minor primary intergranular porosity remains, and variable amounts of micropores and secondary intragranular porosity with poor connectivity occur in the Chang 7 tight shaly sandstones. Assuming spherical pores, a new model to calculate the fractal dimension of pore structure from the NMR T2 distributions is proposed. The fractal dimensions of all the samples are calculated, and the accuracy of the proposed model is verified by the regression coefficients. The microscopic pore structures are heterogeneous in these tight sandstones according to the high value of fractal dimensions. Micropores are the primary causes of heterogeneity in tight sandstones, and samples with unimodal T2 distribution behaviors and high content of short components have the highest fractal dimension and heterogeneity. The calculated fractal dimension is strongly correlated with T2peak and T2gm; therefore, the fractal model proposed in this study can be used to calculate the fractal dimensions and evaluate the heterogeneities of the porous rocks satisfactorily. The fractal model proposed in this study helps to quantitatively assess the pore structures of tight sandstones using NMR measurements.
Introduction
Knowledge of pore size distribution is critical for understanding both storage and transport properties of porous sedimentary rocks (Pape et al., 2006; Anovitz et al., 2013; Clarkson et al., 2013). As complex geological materials, there are many irregular pores that occur at different scales in the porous sedimentary rocks (Wang et al., 2012). Because of the complexity and irregularity of the pore size distribution (pore size and shape, tortuosity, and pore connectivity), it is difficult to quantitatively characterize pore structure by traditional Euclidean geometry (Wang et al., 2012). Several studies have suggested that the pore systems of sedimentary rocks have a fractal nature (Friesen and Mikula, 1987; Hansen and Skjeltorp, 1988; Krohn, 1988; Broseta et al., 2001; Li and Horne, 2006; Li, 2010a; Giri et al., 2012; Daigle et al., 2014a; Lai and Wang, 2015; Sakhaee-Pour and Li, 2016). Fractals are defined as virtual, self-similar objects that appear identically independent of the scale of magnification (Kulesza and Bramowicz, 2014), and these self-similar fractal objects could be characterized by the fractal dimension (Df) (Giri et al., 2012; Lai and Wang, 2015; Weller et al., 2016; Zhou and Kang, 2016). The fractal theory builds up the relationships between microscopic pore structures and macro petrophysical parameters (porosity and permeability) (Hu et al., 2012). By calculating the fractal dimensions of the sedimentary rocks, the complexity and heterogeneity of the highly disordered pore systems could be quantitatively characterized (Cai et al., 2010; Li, 2010a; Wang et al., 2012), and the fractal descriptions of pore systems can also be used for prediction of petrophysical properties such as permeability, wettability, tortuosity, diffusivity, and electrical conductivity (Daigle et al., 2014a).
Scanning electron microscopy (SEM) (Katz and Thompson, 1985), small-angle neutron scattering (Wong et al., 1986; Clarkson et al., 2013), thin sections (Xu and Wang, 2013), nitrogen adsorption desorption (Yang et al., 2014; Bu et al., 2015), pore-scale images (Sakhaee-Pour and Li, 2016), mercury intrusion (Li, 2010a; Nooruddin et al., 2014), and nuclear magnetic resonance (NMR) measurements (Daigle et al., 2014a) could be used to infer fractal dimensions of porous rocks. The NMR measurements record the spin axis relaxation times of hydrogen atom or protons 1H in the presence of external and static magnetic fields (Coates et al., 1991; Daigle et al., 2014b; Dillinger and Esteban, 2014). Besides permeability prediction, fluid type evaluation, assessment of different volumes of pore fluid (free water, clay-bound water, and hydrocarbons), and determination of pore size distribution can be obtained from NMR data (Pape and Clauser, 2009; Daigle et al., 2014b). The NMR measurements of relaxation time made in the laboratory on saturated core plugs are widely used to characterize the pore systems and fluids in porous media (Daigle et al., 2014a; Sigal, 2015). Although direct determination of pore sizes from relaxation times requires calibration with mercury injection capillary pressure (MICP) methods to determine the surface relaxivity, the NMR relaxation time distributions could be used to determine the pore size distribution (Daigle and Johnson, 2016) and therefore offer a rapid, nondestructive method to determine fractal dimensions of the sedimentary rocks (Daigle et al., 2014a).
The major goals of this paper are to derive a fractal model from NMR measurements and to investigate the fractal characteristics of Chang 7 tight shaly sandstones from the Ordos basin of west China. Pore size distributions are determined from the NMR transverse relaxation time (T2) spectrum, and the NMR parameters such as capillary and clay-bound water content (bulk volume irreducible [BVI]), mobile water content (free fluid index [FFI]), the value of T2 separating the BVI from FFI (T2cutoff), the amplitude weighted mean on a logarithmic scale (T2gm), and the value of T2 that shows the highest frequency on the T2 spectrum (T2peak) are then determined from the NMR measurements. The fractal dimension, which was used to present the fractal characterization, was then calculated from NMR T2 distribution data. Then the relationships between NMR parameters and fractal dimensions were analyzed. A fractal model is proposed in this study to calculate the fractal dimensions of tight sandstones using NMR measurements. The work presented here helps extend the application of NMR measurements and our understanding of the microscopic pore structure and heterogeneity of reservoir rocks, particularly for tight sandstones having experienced extensive diagenetic modifications.
Geological Backgrounds
The Ordos basin, with an area of 320,000 km2 (123,000 mi2), is a large sedimentary basin located in the western part of the North China block (Yang et al., 2005), and it can be divided into six geological structural units: the Yimeng uplift, Jinxi fold belt, Yishan slope, Tianhuan depression, Western thrust belt, and Wei River uplift (Figure 1A) (Lai et al., 2016b). Abundant hydrocarbon resources are present in the Upper Triassic Yanchang Formation, which consist of lacustrine deltaic and fluvial siliciclastics with a thickness of 1000–1500 m (3281–4921 ft) (Zeng and Li, 2009; Cao et al., 2016b). The development of the Ordos basin can be divided into three evolutionary stages: Cambrian–Early Ordovician cratonic basin, Middle Ordovician–Middle Triassic cratonic basin, and Late Triassic–Early Cretaceous intraplate remnant cratonic basin (Yang et al., 2005). The Ordos basin became an isolated lake during the Middle and Late Triassic, and a series of lacustrine and deltaic clastic sediments were deposited in the basin, the Yanchang Formation (Ji et al., 2008). The margins of the Ordos basin experienced intense tectonic movements; however, its interior was not strongly deformed because of the rigid basement, and the Ordos basin is characterized by a stable tectonic setting (Yang et al., 2005). The Yanchang Formation can be subdivided into 10 members, namely, Chang 1 to Chang 10 from top to bottom (Figure 1B) (Lyu et al., 2016). Among them, the Chang 7 member (oil layer) consists of oil shale and black mudstone interbedded with fine-grained sandstone and siltstone (Li et al., 2011; Lai et al., 2016b). Traditionally, the sixth and eighth members (Chang 6 and Chang 8) of the Yanchang Formation are the main Mesozoic reservoirs in the Ordos basin. Currently, with the exploration and development of tight oil resources, hydrocarbons could also be produced in tight shaly sandstones and siltstones in the Chang 7 oil layers (Lai et al., 2016b). Tight oil has become the focus of research in global petroleum geology (Cao et al., 2016a). The dark gray lacustrine mudstones and shales within Chang 7 oil layers act as source rocks in this hydrocarbon system, and these tight sandstones interbedded with Chang 7 mudstones and shales have the advantage for trapping oil because of closer proximity to lacustrine source rocks (Figure 1B).
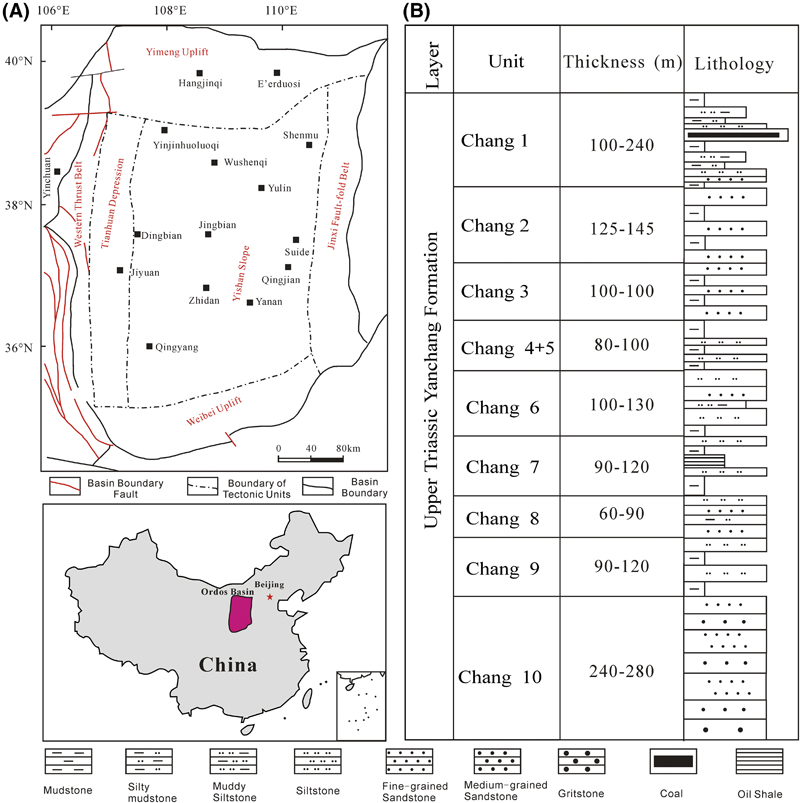 Figure 1. (A) The tectonic divisions of Ordos basin and (B) lithology column of Upper Triassic Yanchang Formation in Ordos basin (Zeng and Li, 2009; Lai et al., 2013a, 2016b).
Theory And Methodology
Theory
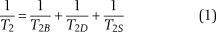
Namely, NMR is the interaction between the nucleus and the magnetic field (Meng et al., 2016). Two types of relaxation times are associated with the NMR measurements, of which longitudinal relaxation time (T1) refers to the characteristic time for the system to return to the equilibrium; in contrast, T2 refers to the characteristic time for the processing secondary magnetic field to lose coherence in the direction perpendicular to the primary magnetic field (Sigal, 2015). The NMR T2 spectrum (relaxation time distribution), which describes the decay of magnetization transverse to an applied, time-varying magnetic field, is preferred in the laboratory because it is a more rapid measurement (Daigle et al., 2014a). The T2 in the NMR measurements can be expressed as (Coates et al., 1991; Kleinberg et al., 1994)
where  is the transverse NMR relaxation time of the full signal,
  is the bulk relaxation,
  is the diffusion-induced relaxation time, and
  is the surface relaxation time (Dillinger and Esteban, 2014; Chi et al., 2016). In water-saturated samples, the relaxation time caused by bulk fluid processes is much longer (order of seconds) than that caused by surface processes (order of milliseconds). For 3.5 wt. % NaCl brine at the temperature of 20°C,
  equals 2.8 sec, which makes 1/T2B commonly negligible. In addition, the measurement may be designed such that 1/T2D may be minimized to a value less than 0.001 sec−1, and this could also be negligible in the T2 distributions (Daigle et al., 2014b; Daigle and Johnson, 2016). The third member (T2S) has the most important effect on porous rocks (Dillinger and Esteban, 2014). Therefore, the NMR T2 could be approximated expressed as (Pape and Clauser, 2009; Daigle et al., 2014b; Müller-Huber et al., 2016)
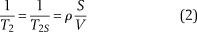
where S (μm2) and V (μm3) are pore surface and volume, respectively, indicating that T2 is directly dependent on the pore surface to pore volume ratio; ρ (μm/sec) is the surface relaxivity of grains and is the coefficient corresponding to each T2 value (Daigle et al., 2014b). By cross-correlating the NMR T2 distributions and MICP pore throat size distributions, Daigle and Johnson (2016) determined that ρ = 16.0 μm/sec for the Devonian Berea sandstone (Ohio), whereas ρ = 6.5 μm/sec for the Silurian Racine dolomite (Illinois). The ratio S/V is the surface/volume ratio of the pore space and is inversely proportional to the pore radius r where the factor depends on the pore shape (Pape and Clauser, 2009; Daigle et al., 2014b; Chi et al., 2016; Müller-Huber et al., 2016):
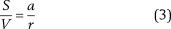
where a is a constant; a = 2 for cylindrical pores, and a = 3 for spherical pores (Pape and Clauser, 2009; Daigle et al., 2014b; Sigal, 2015; Müller-Huber et al., 2016).
An assumption of pore shape is required to convert the NMR relaxation spectrum to a pore size distribution (Sigal, 2015). Previous studies confirm that the number of pores in sandstones does not stay the same with progressive diagenesis, and pores become more spherical with increasing diagenetic modifications (Cook et al., 2011). The Chang 7 tight shaly sandstones are characterized with low porosity, ultralow permeability, and strong microscopic heterogeneity, which is the result of the extensive diagenetic modifications (Lai et al., 2016b). The NMR measurements are more sensitive to pore body size instead of pore throat sizes because the majority of the pore volume is assumed to be composed of pore bodies (Daigle et al., 2014b); therefore, this study assumed the pore shapes to be spheres. Assuming spherical pores and that the magnetic field gradient was constant and equal in all pores (Daigle et al., 2014b), then the T2 distributions are therefore functions of pore sizes where the constants of proportionality are the surface relaxivities (Sigal, 2015):
The T2 distributions determined from NMR measurements could be converted to pore size distributions; each T2 relaxation time constant corresponds to a particular pore radius (Mitchell and Fordham, 2014; Sigal, 2015). From equation 4, it could be concluded that larger pores are associated with longer relaxation times (Mitchell and Fordham, 2014), whereas NMR T2 relaxation time of small pores is short (Meng et al., 2016). The signal amplitude is proportional to the number of protons, i.e., the pore volume, and the higher the signal amplitude, the more the porosity (Dillinger and Esteban, 2014; Meng et al., 2016).
Experimental Measurements
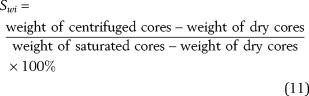
A collection of cores was retrieved from seven wells (G273, Z143, L89, H212, A92, Y63, and B272) drilled in the central Ordos basin. The porosity and air permeability measurements were performed on 458 core plug samples under a confining pressure of 200.0 psi (1.4 MPa). A subset of 100 of these samples was sent to Core Laboratories at PetroChina Research Institute of Petroleum Exploration Development for NMR measurements to determine the T2 distributions. The NMR experiment processes are according to the Chinese standard “Specification for normalization measurement of core NMR parameter in laboratory” (SYT6490-2007) (National Development and Reform Commission, 2007), with the same experimental procedure as shown in previous research (Yao et al., 2010). First, the weight of the dry core plug is measured, then the weights of 100% saturated and centrifuged core plug are also measured. Thus, the saturation of the irreducible water content can be derived.
The experiment temperature was 25°C. The NMR T2 distributions were performed on these core plug samples of 1.5 in. (3.8 cm) in diameter and 1 in. (2.5 cm) in length. For all the 100 samples used in this study, the nitrogen porosity, water porosity, and NMR porosity were measured, whereas the air permeability was measured under atmospheric stress and at net confining stress of 800.0 psi (5.5 MPa). Because of the very low–permeability nature of the rock matrix, some samples were unable to continue testing at net confining stress of 800 psi.
The NMR apparatus (MARAN-DRX/2) provides 2 MHz frequency of the main magnetic field, waiting time (TW) for 6000 msec, and echo spacing (TE) of 0.3 msec performed to obtain each relaxation curve. The NMR parameters were installed by maximum echo numbers of 4096 and scanning numbers of 64. This apparatus records the net magnetization of proton 1H in the presence of an external magnetic field (Dillinger and Esteban, 2014). The samples were fully saturated with NaCl brine with a salinity of 41,000 mg/L, and the NMR T2 distributions (incremental and cumulative) at 100% brine saturation were measured. The signal/noise ratio for the NMR measurements was a minimum of 100:1. Then the core plug samples were removed with the free water by a centrifugal machine. The rotation speed of the centrifugal machine is 9000 rpm, and the 100% brine-saturated core plugs were kept in this machine for 1 hr to remove the free water. The NMR T2 relaxation time distribution was used to identify total porosity, effective porosity, permeability, irreducible water, mobile water, and geometric mean of the T2 distribution (T2gm). The T2cutoff values could be calculated by comparisons of the T2 distributions at 100% brine saturation and those at bound water.
The SEM analysis was conducted on the fresh surface of the core plug samples, which are coated with gold to help detect the micropores associated with authigenic clay minerals. Thin sections, which were impregnated with red epiflourescent epoxy, were analyzed to determine intergranular and intragranular pores.
Methodology
Self-affinity with a dimension is an important feature of fractal objects in nature, and this feature can be mathematically illustrated by a power-law function (Mandelbrot, 1977; Li, 2010a; Daigle et al., 2014a; Zhang and Weller, 2014):

where r is characteristic length of a unit (for sedimentary rock, it is the pore radius),  means “proportional to,” N(r) is the number of objects whose sizes are greater than the size r, and Df is the fractal dimension (Li, 2010b). Generally, the Df is in range 2.0 < Df < 3.0 in porous media (three-dimensional spaces) (Broseta et al., 2001; Cai et al., 2010; Jin et al., 2013; Lai et al., 2013b; Gao et al., 2014). The value of fractal dimension is a representation of rock heterogeneity, and the greater the fractal dimension, the greater the heterogeneity (Li and Horne, 2006). Generally, Df approaches 2.0 for smooth, clay-free rocks, whereas values close to 3.0 are typical of strongly argillaceous sandstones with high heterogeneity (Broseta et al., 2001).
Based on equation 5, many scientists inferred the formulas to calculate the fractal dimensions of pore structure from the MICP according to the capillary tube model and Young–Laplace law (Friesen and Mikula, 1987; Broseta et al., 2001; Li, 2010a, b; Schmitt et al., 2013; Lai and Wang, 2015).
As stated above, the distribution of pore sizes obtained from NMR measurements could be described by a fractal model (equation 5). The NMR T2 relaxation time distributions could be related directly to pore size distributions (Daigle and Johnson, 2016). The NMR T2 measurements provide relaxation curves that are functions of time. It is generally assumed that each time constant (T2 value) represents a particular pore size (Sigal, 2015). The signal amplitude at this relaxation time (T2i value) is a function of the number of protons and therefore the porosity (pore volume, Vpi) corresponding to this pore radius ri (Dillinger and Esteban, 2014).
In the fractal model, the total volume of the pores (Vp, %) is expressed as the total porosity, which could be directly measured from the core plug samples. The Vp values are the sum of the signal amplitudes from the minimum to maximum T2 values performed on saturated core plugs. Suppose the pore volume corresponding to pore radius ri, i.e., T2i, is Vpi; then the Vp could be given by
where Vp1 corresponds to the minimum T2 values, T2min, whereas Vpn corresponds to the maximum T2 values, T2max. The pore volume measured at each characteristic size Vpi is equal to the signal amplitude at the corresponding NMR T2 relaxation time or, in other words, the pore volume associated with the ith time constant T2i (Sigal, 2015).
The pore shape is assumed to be spherical, and then the numbers of pores of a given size ri (T2i value) are expressed in
Therefore, the pore numbers composed of pore size larger than ri are given by
where j = i + 1.
Equation 9 can be obtained by combining equations 4, 5, and 8:
Equation 9 could be expressed as follows:
where  and
and  . Therefore, log(1/A) is a constant, and
  is also a constant.
Equation 9 generally demonstrates that the relationship between the numbers of pores greater than ri, i.e., N(r) derived from NMR measurements and the pore radius (r) is linear in a double-logarithm coordination (log(N(r)−log(r))). Equation 10 demonstrates that the relationship between  and the pore radius (r) is linear in a double-logarithm coordination. The fractal dimension can then be derived from the slope of the best fit line in the log–log plot of pore numbers (N(r)) against pore radius r (T2).
Results
Porosity, Permeability, and Pore Systems
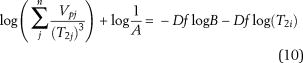
Core-measured porosity and air permeability of the 444 samples show that porosity ranges from 2.28% to 17.74% and averages 7.48%. Air permeability ranges from 0.0025 to 4.42 md with an average of 0.13 md (Figure 2). Some samples are characterized by high porosity but relative low permeability or low porosity but high permeability, and the coefficient of determination (R2) between permeability and porosity is low, possibly reflecting wide differences in dominant pore types (Figure 2) (Lai et al., 2016b). Observations by thin section petrography and SEM indicate that pore systems in the Chang 7 tight shaly sandstones are of both primary and secondary (partial to complete dissolution of framework grains) origins (Figure 3) (Lai et al., 2015c). Minor primary intergranular porosity remains (Figure 3A), and variable amounts of secondary intragranular porosity caused by dissolution of detrital framework grains occur in many samples (Figure 3B). Abundant micropores are associated with the authigenic clay minerals such as illite and chlorite (Figure 3C). Most of the secondary dissolution pores are small pores or micropores with poor connectivity (Figure 3D) (Lai et al., 2016b).
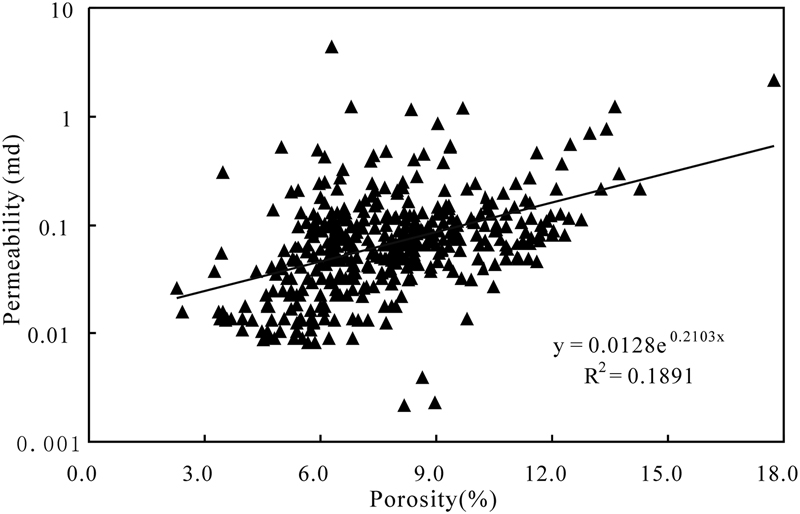 Figure 2. Plot of core-measured porosity and air permeability measured at a net confining stress of 200 psi. R2 = coefficient of determination.
 Figure 3. Photomicrographs showing pore systems for Chang 7 tight oil reservoirs in Ordos basin. (A) Primary intergranular pore (red arrow) coexisting with the secondary dissolution pores (blue arrow), An 236, 2156.83 m (7076.21 ft), plane polarized light. (B) Secondary dissolution pores, An 237, 2155.22 m (7070.93 ft), plane polarized light. (C) Micropores (red arrow) associated with authigenic clay minerals, scanning electron microscopy (SEM). Information along the bottom includes magnification (mag), voltage (HV), wide diameter (WD), horizontal field width, and the sample depth. (D) Honeycomb-like pores (red arrow) with poor connectivity, SEM.
Pore Size Distribution
The NMR T2 spectrum provides significant information on the pore structure of rocks (Dillinger and Esteban, 2014). The incremental and cumulative T2 distributions for the 100% brine-saturated and partially brine-saturated (centrifuged) core plug samples are shown in Figure 4. It is evident from Figure 4 that each T2 value (T2min and T2max) corresponds to certain signal amplitudes, which are the pore volumes at this pore radius r (T2). The signal amplitudes of the saturated samples are much higher than those of the unsaturated samples (Figure 4), indicating that the signal amplitudes are proportional to the water (or hydrocarbon) content of the core sample. The cumulative porosities for both the 100% brine-saturated and unsaturated core plug samples increase with the T2 values, and the cumulative porosity for the unsaturated samples will reach its maximum values, which equals to the total immobile porosity. For example, the maximum value of the cumulative porosity for the unsaturated sample in Figure 4 is 8.43%. Similarly, in the cumulative porosity curves for the saturated samples, it will also reach this value at some certain T2 value. Then this T2 value is called the T2cutoff, which separates the capillary and clay-bound water (BVI) residing in micropores and clay minerals from the movable (free) water (FFI) present in macropores (Dillinger and Esteban, 2014). The T2cutoff values could be determined in this way; for example, the T2cutoff is 4.64 msec in Figure 4. The BVI volume can then be calculated by incrementing the signal amplitude at each relaxation time until T2 reaches the T2cutoff (or in short, the BVI volume equals to the maximum cumulative porosity for the unsaturated sample), whereas the FFI volume can be calculated by subtracting the BVI volume (8.43%) from the total porosity (15.38%) or, in other words, the total cumulative amplitude of the NMR signal (Dillinger and Esteban, 2014). The parameter T2peak (Rezaee et al., 2012) can also be determined from the NMR T2 distribution (Figure 4). However, it should be noted in Figure 4 that there is still a small quantity of water even at larger pores (T2 > T2cutoff) accounted as bound water because the unsaturated curve is not zero (Figure 4).
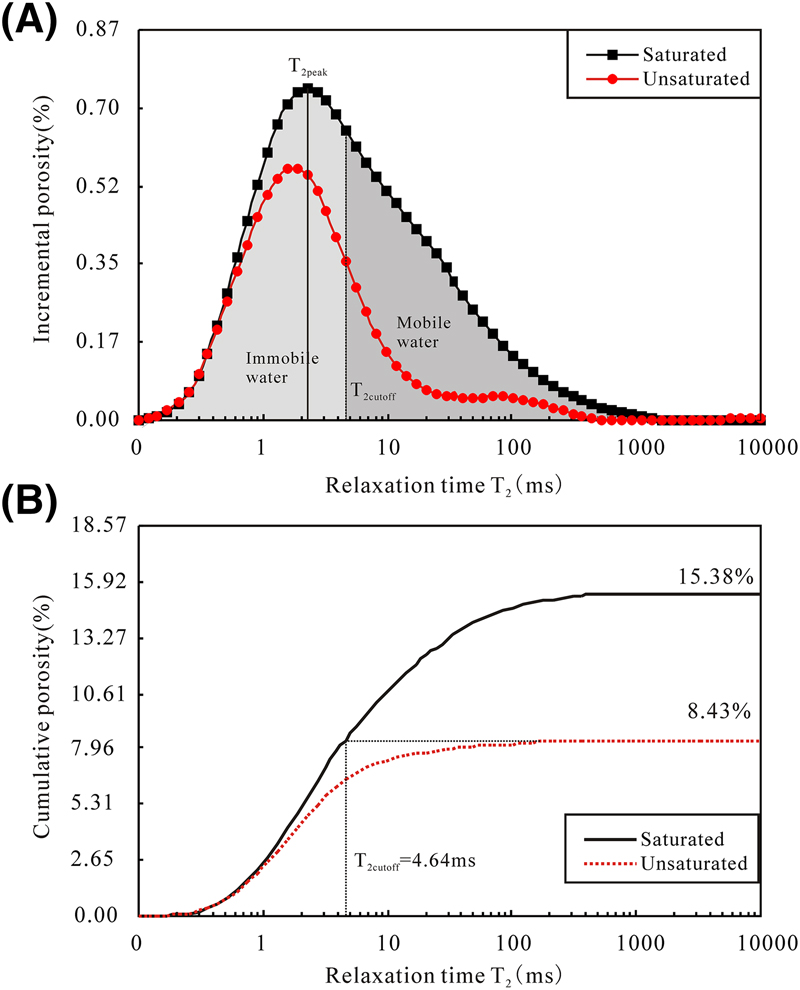 Figure 4. (A) The incremental porosity distribution as a function of the transverse relaxation time (T2). The value of T2 separating the bulk volume irreducible from free fluid index (T2cutoff) separates the T2 spectrum into two parts: movable water and irreducible water. (B) The cumulative porosity distribution as a function of the relaxation time.
Total NMR porosity, capillary and clay-bound water content, mobile water, T2cutoff, T2gm values, and T2peak values from NMR measurements are presented in Table S1 (supplementary material available as AAPG Datashare 89 at www.aapg.org/datashare). The results show that these samples have a relatively high content of capillary and clay-bound water. The BVI is in the range from 46.69% to 92.46% with an average of 68.51% of the total porosity, indicating that more than half the porosity and the number of voids are associated with clay minerals and within capillary pore sizes. The T2cutoff reveals a wide range from 1.00 to 56.98 msec and averages as 19.03 msec, whereas the T2gm is in the range of 2.17 to 20.90 msec (averaging 9.39 msec) (Table S1, supplementary material available as AAPG Datashare 89 at www.aapg.org/datashare). The T2peak shows a wide range from 0.9 to 86.4 msec and has an average of 21.4 msec (Table S1, supplementary material available as AAPG Datashare 89 at www.aapg.org/datashare). The wide range of these NMR parameters implies that these samples have various pore structure and heterogeneity.
The weighting method is introduced here to calculate the content of irreducible water (equation 11). The BVI values (capillary and clay-bound water content), which are derived from the NMR T2 distribution, are strongly positively correlated with the irreducible water saturation (Swi) derived from the weighting method (Figure 5), possibly implying that the method for calculating the T2cutoff and BVI value from NMR measurement is reliable.
According to the NMR laboratory measurements on the 100% brine-saturated core plugs, the cumulative T2 distributions display unimodal and bimodal behaviors (Figures 6A, B; 7A, B), representing a geometrical arrangement composed of small to large pore size domains. The bimodal behaviors possibly indicate the coexisting of the micropores and macropores, suggesting the presence of a wide range of pore sizes in these heterogeneous sandstones. The short components with small T2 values (T2s) refer to the microporosity associated with clay minerals and capillary pore sizes, whereas the long or large components with large T2 values (T2l) correspond to the macroporosity including large intergranular pores or microfractures (Figure 6A, B) (Dillinger and Esteban, 2014; Müller-Huber et al., 2016). Figure 6A (sample 36) shows the typical bimodal behavior of the NMR T2 distribution. Strong T2l components are presented in this sample, representing the high content of movable water (FFI) existing in the macropores. In contrast, the T2s is weak in this sample, indicating a moderate content of capillary or clay-bound immobile water (65.3%). One distinct peak characterized by right-skewed distribution is observed (lower left peak but higher right peak) (Figure 6A). The two distinct peaks in this sample indicate a discontinuous pore size distribution, which could be related to poor sorting of the pore systems. The T2cutoff is set at approximately 25.95 msec; therefore, 65.3% of the full NMR signal (i.e., the total porosity) is made of irreducible water (Figure 6A). Figure 6B shows another typical bimodal behavior of the T2 distribution acquired on sample 35. However, it is different from that of sample 36 in Figure 6A. From the T2 spectrum, it can be concluded that both T2s components and T2l components are strong in this sample (Figure 6B). However, the full NMR signal (total porosity) is much lower than that of the sample in Figure 6A. The T2cutoff is determined at 27.33 msec, and the BVI value is approximately 85.5%, representing that the fluids in this sample are dominantly the capillary or clay bound immobile water residing in micropores. It is evident that the complexity and heterogeneity of the microscopic pore structure of sample 36 in Figure 6B are greater than those of sample 35 in Figure 6A.
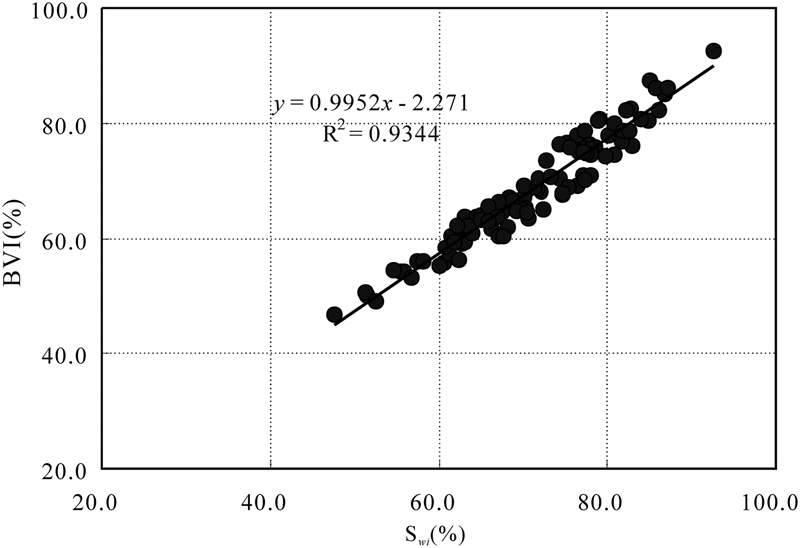 Figure 5. Plot of bulk volume irreducible (BVI) from nuclear magnetic resonance measurements versus irreducible water saturation (Swi) derived from weighting method.
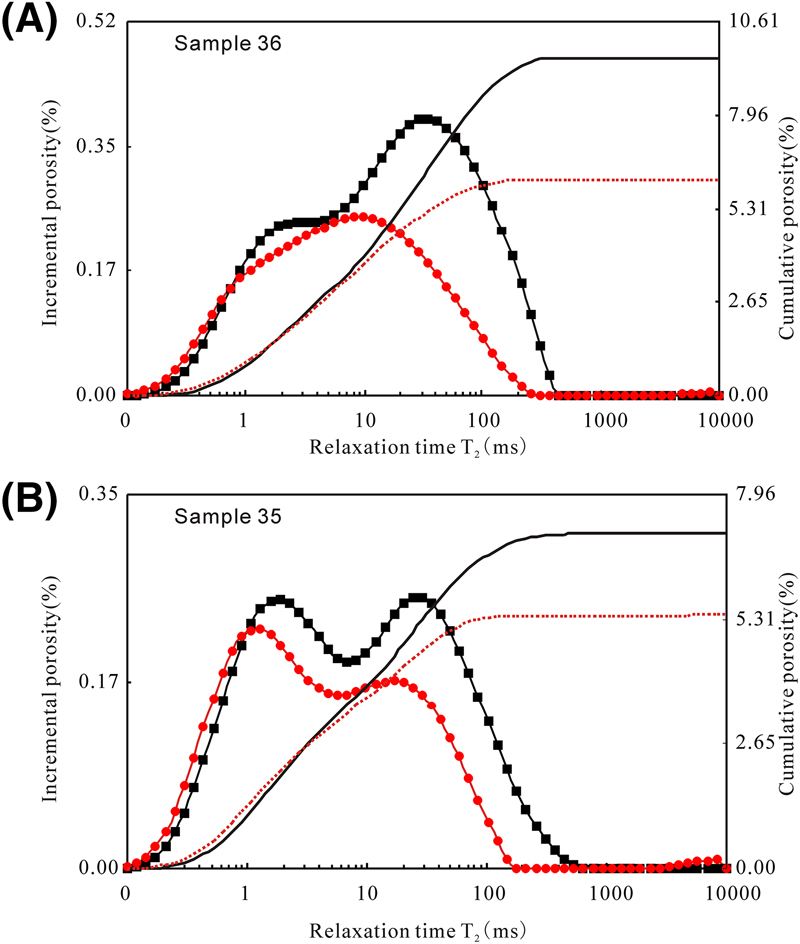 Figure 6. Nuclear magnetic resonance (NMR) transverse relaxation time (T2) incremental and cumulative spectra. Note that the T2 incremental spectra of these samples show bimodal behaviors. (A) Typical bimodal behavior of the T2 distribution. Both T2s components and T2l components are strong. (B) Bimodal behavior, the full NMR signal is lower. Black squares indicate saturated, red circles indicate unsaturated.
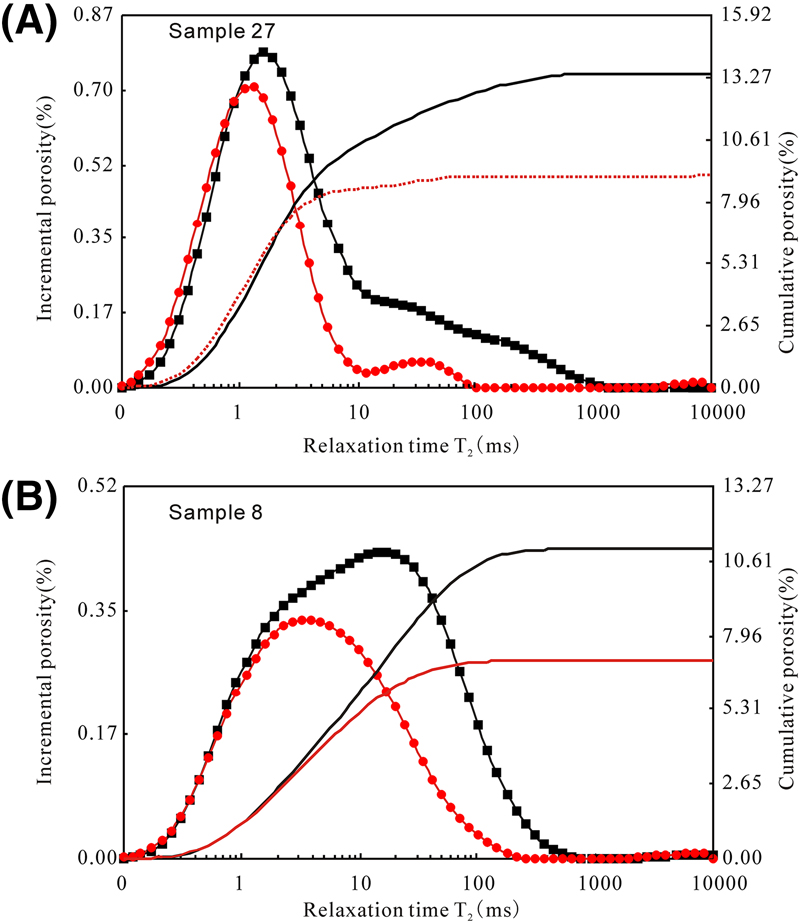 Figure 7. Nuclear magnetic resonance transverse relaxation time (T2) incremental and cumulative spectra for samples show unimodal behaviors. (A) Typical unimodal behavior of the T2 distribution, and short T2 components are dominant. (B) Typical unimodal behavior of the T2 distribution, and relatively long T2 components are dominant. Black squares indicate saturated, red circles indicate unsaturated.
However, there are some samples that display unimodal behaviors (Figure 7A) (sample 27). In the T2 relaxation time distributions of this sample, there is only one modal representing the T2s components, and there are no or very weak T2l components (Figure 7A). The values of T2gm and T2cutoff for this sample are very low (3.63 and 3.78 msec, respectively), indicating that there is minor movable water (31.7%) presented in this sample. Also there are some samples displaying unimodal behaviors that have high T2gm and T2cutoff values (sample 8), and the T2 scales are higher (Figure 7B). Generally speaking, both the T2s components and T2l components are presented (Figure 7B). The NMR parameters such as T2peak and T2gm of sample 8 in Figure 7B are much higher than those of sample 27 in Figure 7A because of sample 8’s abundance in large pores.
It should be noted that there are minor or even no components greater than 100 msec, indicating the rarity of large pores and absence of microfractures in these samples (Figures 6, 7). Table S1 (supplementary material available as AAPG Datashare 89 at www.aapg.org/datashare) also lists the behavior for the NMR T2 distribution for all the samples (unimodal or bimodal).
Fractal Analysis
The pore volume or the signal amplitude Vpi (%) measured at each T2i relaxation time (msec) is also summarized, and then Vpi is divided by (T2i)3; and thus, the parameter  , which is proportional to the number of pores at this particular pore size (ri or T2i), could be obtained in this way. The sum of the parameter
  , i.e.,
  , is therefore proportional to the total number of pores. Then the parameter
 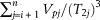 , which corresponds to the relative numbers of pores larger than pore radius ri, is also summarized. All these results for sample 36, whose NMR T2 distribution is presented in Figure 6A, are clearly presented in Table S2 (supplementary material available as AAPG Datashare 89 at www.aapg.org/datashare).
Suppose that  equals to N(rj). The value of N(rj) is proportional to the number of pores larger than pore radius ri; then equation 10 could be expressed in short as

The fractal dimension of the pore structure can be derived from the slope of best fit line on the log–log plot (equation 12). In Figure 8A, log(N(rj)) was plotted against log(T2) for sample 36 (the T2 spectrum is presented in Figure 6A), and a good, straight regression line with a R2 greater than 0.98 is observed, indicating that the pore structures of this sample are generally fractal and can be characterized by the theories of fractal geometry. The slope of the best linear fit line is −2.485, which implies that the fractal dimension of the pore structure is 2.485 (Figure 8A). A similar phenomenon is found in core sample 35 (Figure 8B), whose NMR T2 distribution is presented in Figure 6B, and the fractal dimension is calculated as 2.685. For samples 27 and 8, whose NMR T2 distributions (unimodal behaviors) are presented in Figure 7A, B, respectively, coefficients of determination of linear regressions are greater than or equal to 0.98, which corroborates the existence of fractal patterns in these samples (Figure 9A, B). The fractal dimension of sample 27 in Figure 9A is 2.935, whereas the fractal dimension of sample 8 in Figure 9B is 2.636 (Figure 9).
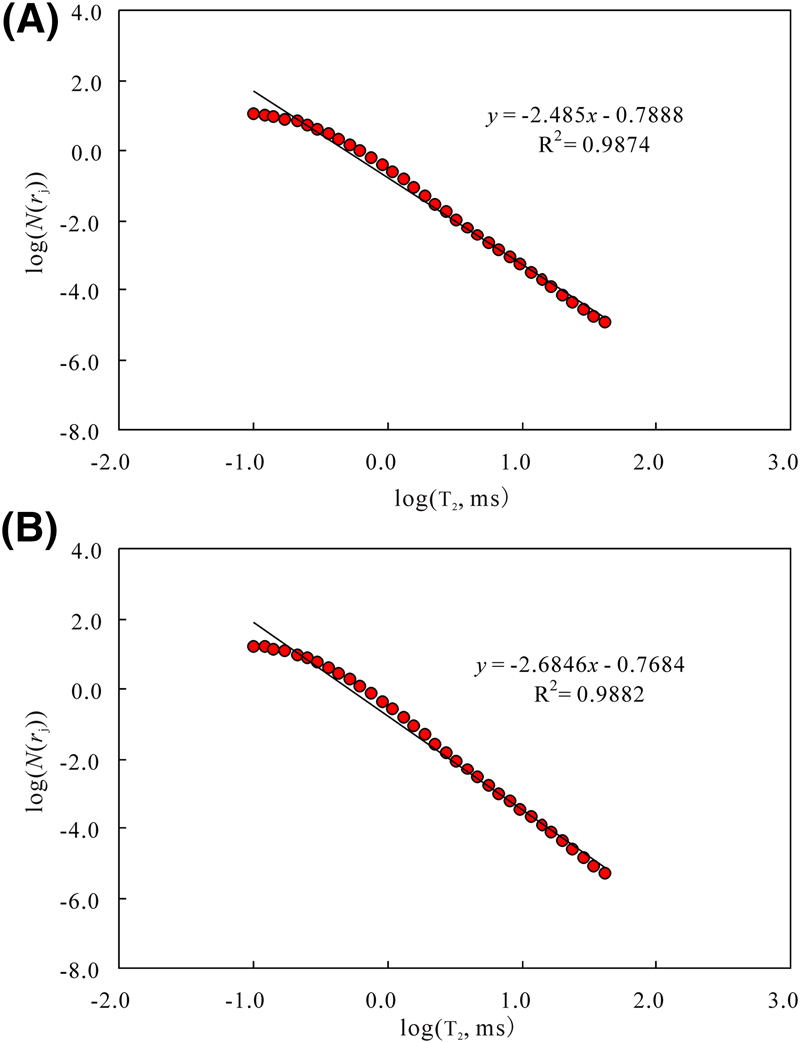 Figure 8. Double-logarithm coordination showing the relationship between the log(N(rj)) (pore numbers with radius larger than pore radius corresponding to transverse relaxation time) and log(T2) (transverse relaxation time) for samples showing bimodal behaviors. (A) Sample 36 and (B) sample 35.
 Figure 9. Double-logarithm coordination showing the relationship between the log(N(rj)) (pore numbers with radius larger than pore radius corresponding to transverse relaxation time) and log(T2) (transverse relaxation time.) for samples showing unimodal behaviors. (A) Sample 27 and (B) sample 8.
The plots of log(N(rj)) against log(T2) represent the relationship between the number of pores and the pore radius. The results show that all of the plots show good fits (high values of R2), and the derived fractal dimensions are all in the range from 2.0 to 3.0 (not included), which indicates that Chang 7 tight sandstone samples are virtually fractal, and the proposed methods in this study can be used to infer fractal dimensions from NMR T2 distributions in theory. The accuracy of the proposed model to calculate the fractal dimension is also based on the R2. Table S1 (supplementary material available as AAPG Datashare 89 at www.aapg.org/datashare) also lists the fractal dimensions and coefficients of determination of the linear regressions. The relatively high values of regression coefficients (R2) indicate that it is sufficient to use the proposed method above for fractal dimension calculation from NMR T2 distributions. The fractal dimensions of the Chang 7 tight sandstone samples are between 2.446 and 2.995 with an average of 2.693 (please refer to Table S1, supplementary material available as AAPG Datashare 89 at www.aapg.org/datashare), indicating that their microscopic pore structures are heterogeneous. The complicacy and heterogeneity of the pore structures increase as the fractal dimensions (Df) increase.
Nuclear Magnetic Resonance Parameters and Petrophysical Parameters
To relate the NMR parameters with the petrophysical parameters, a comparison is needed. In this section, the NMR-derived porosity and permeability are calibrated with the core-measured porosity and permeability.
As previously demonstrated, the nitrogen porosity and water porosity as well as the NMR porosity were measured in the NMR measurements. Regression analysis shows that the NMR porosity is strongly correlated with the nitrogen porosity with a R2 of 0.92 (Figure 10A). In addition, the linear trend line with a regression coefficient R2 > 0.98 supports a good relationship between NMR porosity and water porosity (Figure 10B).
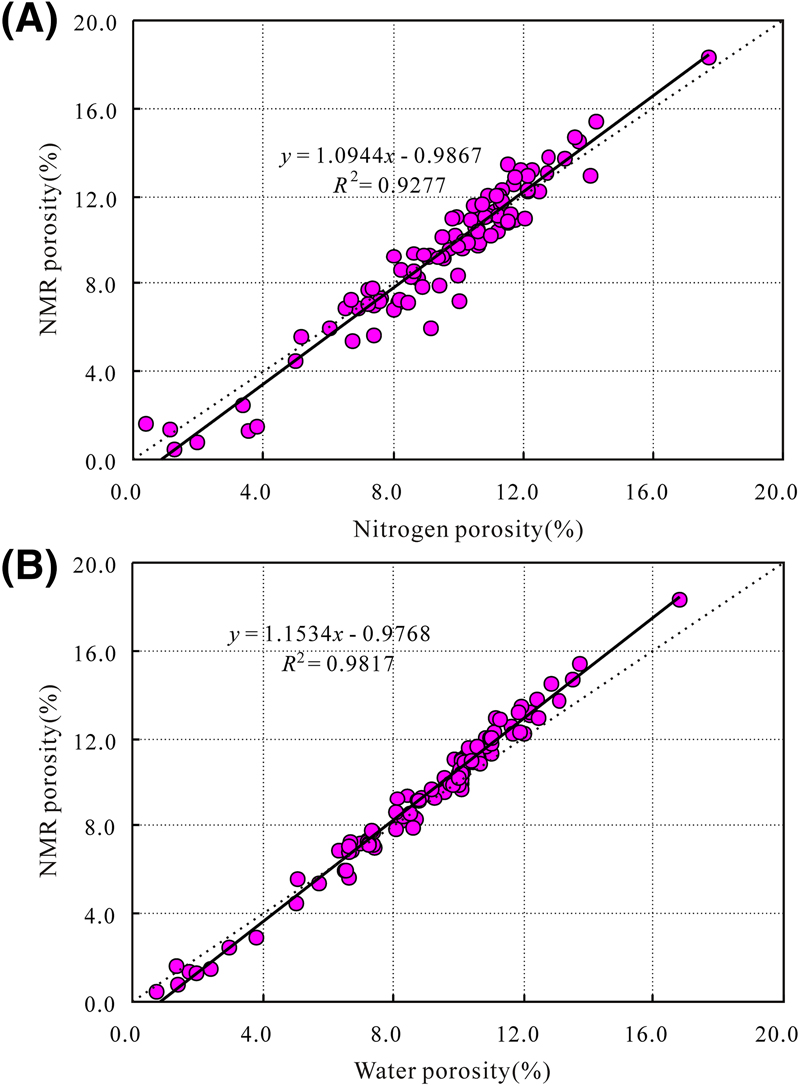 Figure 10. Plot of nuclear magnetic resonance (NMR) porosity versus (A) nitrogen porosity and (B) water porosity. R2 = coefficient of determination.
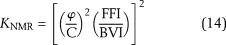
Previous studies show that there are generally two models that can be used to calculate permeability using the NMR measurements, known as Schlumberger Doll Research (SDR) and Coates models. The SDR model is expressed in equation 1 (Glover et al., 2006):

where KSDR is permeability (md), ϕ is the fractional NMR-derived porosity, and T2gm is the logarithmic mean value (msec). The value of D is a constant, and it can be determined through calibration with core-measured permeability (Rezaee et al., 2012).
Coates et al. (1991) developed the free fluid model, which estimates the permeability based on the FFI and the BVI:
where KNMR is permeability (md) and ϕ is the fractional NMR-derived porosity. The value of C is a constant (Coates et al., 1991; Rezaee et al., 2012).
The regression analysis shows that the SDR model coefficient  is best correlated with the core-measured air permeability measured at 800 psi with a R2 of 0.77 (Figure 11). The constant D in equation 12 can be defined as 1.133 (Figure 11). In contrast, no evident relationship is observed between core-measured permeability and Coates model coefficient with regression coefficients of only 58% (Figure 11B). Therefore, the SDR method has an advantage in deriving the in situ permeability with confining pressure over the Coates models (Figure 11). However, no evident relationship is observed between air permeability measured under atmospheric stress and KSDR (Figure 11). In fact, for tight sandstones, only the permeability performed under a net confining stress can be used to characterize the actual flow capacity at reservoir conditions. Therefore, T2gm could represent both the microscopic pore structure and macroscopic petrophysical properties of Chang 7 tight sandstones.
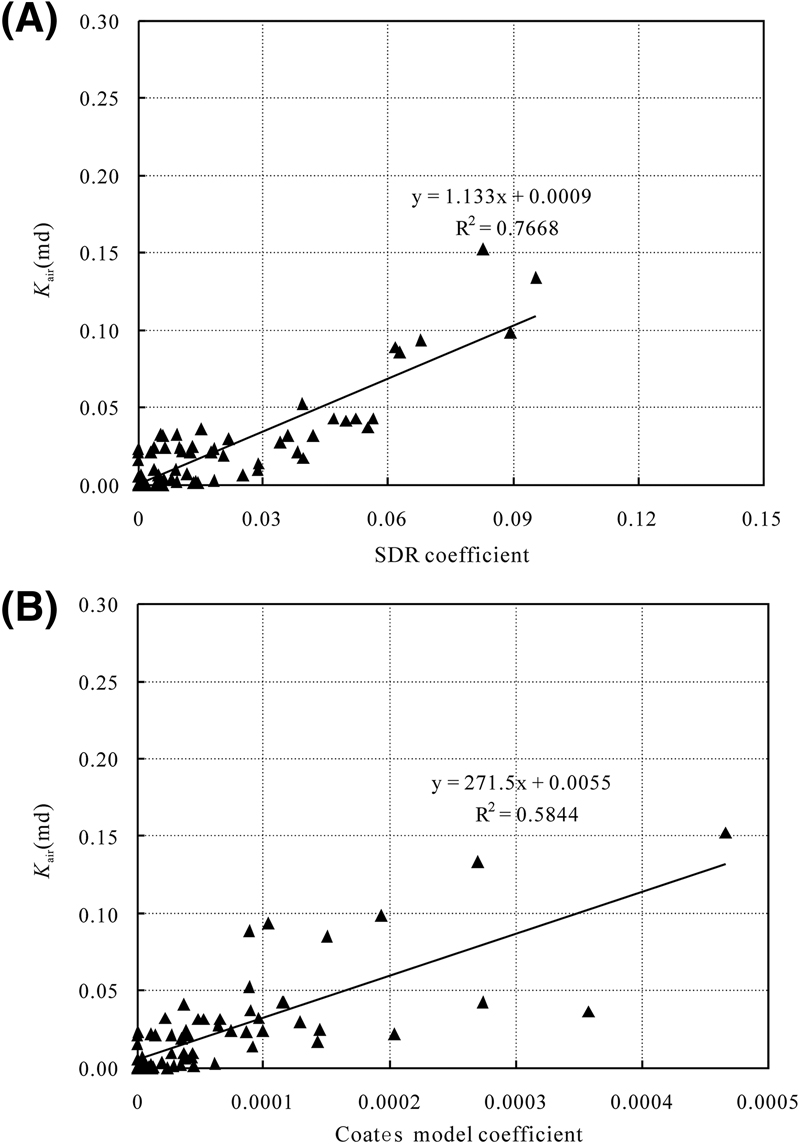 Figure 11. Plot of permeability measured at 800 psi versus (A) KSDR and (B) KNMR by the Coates model. Note that some samples were unable to measure permeability at net confining stress of 800 psi. R2 = coefficient of determination.
Discussion
Tight sandstones can be distinguished petrographically from sandstones with higher permeability by (1) loss of primary intergranular porosity through diagenesis and (2) occurrence of most secondary dissolution porosity (Nelson, 2009; Zou et al., 2012). The tight sandstones are commonly characterized by typically poor reservoir quality with strong heterogeneities caused by the complex deep-burial diagenetic history (Higgs et al., 2007; Lai et al., 2015a). It is difficult to quantitatively describe the complexity and heterogeneity of the pore structure for tight sandstones (Lai and Wang, 2015; Lai et al., 2016a). Diagenesis alters the amount and distribution of pore spaces, creating smaller and more disconnected pores (Cook et al., 2011; Lai et al., 2015b). Diagenetic modifications also are important factors in the fractal nature displayed by sedimentary rocks (Giri et al., 2012).
Besides determining pore size distributions and calculating parameters such as mobile water content, T2cutoff and T2gm values, the NMR T2 measurements made in the laboratory on saturated core plugs can also be successfully used to determine the fractal dimensions of the pore systems. Fractal dimensions are quantitative descriptions of the microscopic pore structures, and they build up the relationships with macroscopic petrophysical properties. The fractal dimensions help to express the shapes of pores and pore throat of the pore systems as a single number. To determine whether the calculated fractal dimensions in this study can represent the pore volume or not, regression analysis between fractal dimension and NMR parameters (T2cutoff, T2peak, and T2gm) was performed.
The NMR parameters such as T2cutoff, T2gm, and T2peak are sensitive to the microscopic pore structures of rocks, and they are macroscopic consequences of the microscopic pore structures. These NMR parameters integrate pore geometry (pore size and shape) and pore connectivity, and they can be used to evaluate the heterogeneity of the reservoir rocks. In addition, the T2gm can also be used to estimate the permeability based on empirical relationships (Figure 11) (Dillinger and Esteban, 2014). The samples in this study show a positive correlation between T2cutoff and T2gm values (Figure 12). Generally, the better the reservoir quality and the pore structure are, the higher the values of T2gm will be. In fact, the large intergranular pore with good connectivity, which has large T2 relaxation times, makes a significant contribution to permeability.
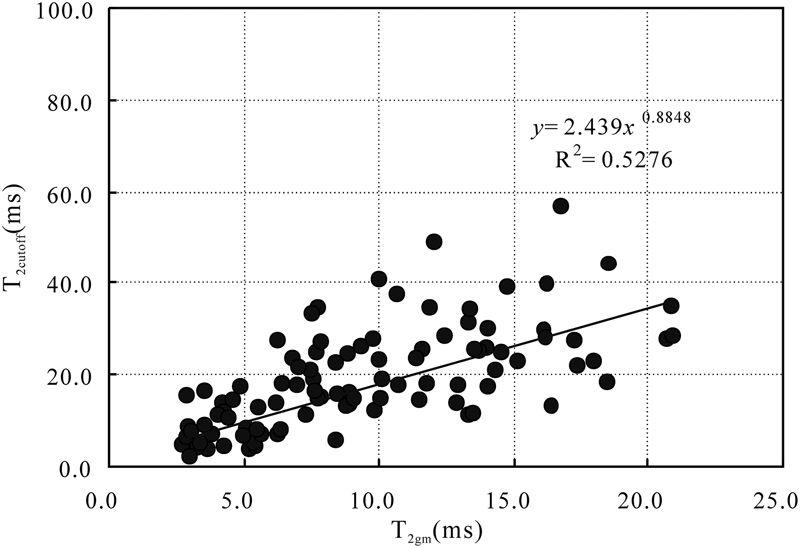 Figure 12. Plot of T2cutoff (value of T2 separating the bulk volume irreducible from free fluid index) versus geometric mean of the transverse relaxation time distribution (T2gm) in Chang 7 tight shaly sandstones. R2 = coefficient of determination.
In the Chang 7 tight shaly sandstones, the pore systems are dominated by small pores (Figure 3) (Lai et al., 2016b). As can be observed from the NMR T2 contribution for the analyzed samples (Figures 6, 7), although some samples display longer components (T2l), the main T2 distribution appears as a major dominant peak at the shorter T2 relaxation times (1–100 msec) (Figures 6, 7). In some samples, there are minor or even no long T2 relaxation times present, which can be attributed to the absence of microfractures and macropores (Figures 6, 7). In fact, for most of the samples analyzed, there are minor peaks or a tail distribution of T2 relaxation time of approximately 100 msec that is most likely related to the remaining larger pores (e.g., Rezaee et al., 2012). If smaller pores (shorter T2 relaxation time) make a dominant contribution to the NMR T2 spectrum, the calculated fractal dimension is high. In contrast, if the NMR T2 distribution contains dominantly longer T2 components, then the fractal dimension value is generally lower. Micropores have a great effect on fractal dimensions of the pore systems (Figures 6, 9).
According to fractal dimensions calculated using the proposed models above, the samples with unimodal T2 distributions averagely have a higher fractal dimension (2.770) than that of the samples with bimodal T2 distributions behaviors (2.634). For example, from Figure 13 it could be concluded that the T2peak and T2gm of the samples with bimodal T2 distribution is higher than that of the samples with unimodal T2 distribution (Figure 13). In contrast, the fractal dimension of the sample with bimodal T2 distribution is generally lower than that of the samples with unimodal T2 distribution (Figure 14). However, the samples with bimodal behavior show a wider distribution of NMR parameters and fractal dimensions, which represents a wider distribution of porous mediums (coexistence of small and large pores) (Figures 13, 14). Especially for the samples with unimodal T2 distribution behaviors and high content of short components (T2s), the fractal dimension of the pore structure approaches 3.0. For example, sample 27 has a fractal dimension of 2.935 (Figures 7A, 9A). Micropores are the primary causes of heterogeneity and irregularity in tight sandstones, and the fractal dimensions reflect the degrees of micropore development (Yang et al., 2014). In contrast, the samples with bimodal behaviors and high content of long components (T2l) have the lowest fractal dimension. For example, sample 36 has a fractal dimension of 2.485 (Figures 6A, 8A). Likewise, the samples with unimodal T2 distribution (Figure 8B, sample 8) may have a similar fractal dimension with those with bimodal behaviors and similar content of long components (T2l) and short components (T2s) (Figure 6B, sample 35). Analysis made by fractal dimension has some degree of uncertainty, and this is mainly attributed to the complicated pore structures of the Chang 7 sandstones. Samples with different T2 distributions may have a similar heterogeneity and fractal dimension.
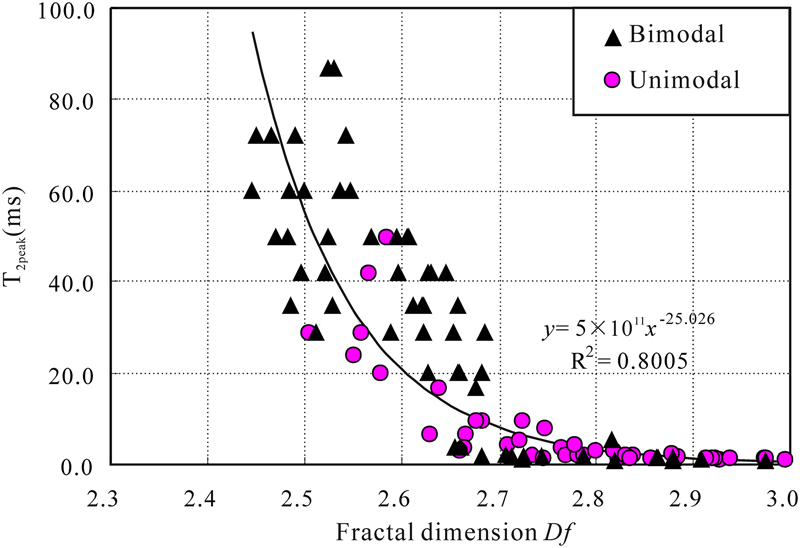 Figure 13. Plot of the value of transverse relaxation time (T2) that shows the highest frequency on the T2 spectrum (T2peak) versus fractal dimension for samples with unimodal and bimodal T2 distribution in Chang 7 tight shaly sandstones. Kair = air permeability; KNMR = Coates model-derived permeability; KSDR = Schlumberger Doll Research method-derived permeability; R2 = coefficient of determination.
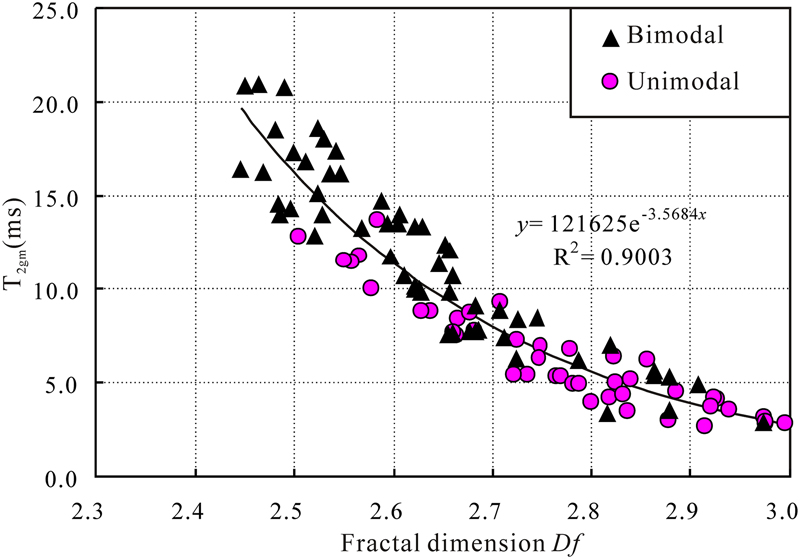 Figure 14. Plot of geometric mean of the transverse relaxation time (T2) distribution (T2gm) versus fractal dimension for samples with unimodal and bimodal T2 distribution in Chang 7 tight sandstones. R2 = coefficient of determination.
The fractal dimension is strongly (R2 = 0.8) negatively correlated with T2peak (Figure 13). The T2peak of the relaxation curve indicates that the dominant T2 relaxation times (i.e., dominant pore sizes) are mostly found at around the T2peak values. Therefore, the fractal dimension can be used to evaluate the pore size distribution, the complexity, and irregularity of the microscopic pore structure. A good correlation between the T2gm and fractal dimension is also observed (Figure 14), and the R2 is as high as 0.9. Therefore, the fractal dimension is shown as a sensitive indicator for the influence of the pore size distribution of porous rocks. Generally, the calculated fractal dimension using the proposed methods in this study could express the pore shape, pore size distribution, and pore connectivity quantitatively as a single parameter.
From the regression analysis between fractal dimensions and NMR parameters, it could be concluded that the fractal dimensions derived from NMR measurements could be used to evaluate the pore structures (pore size and shape and pore size distribution) and heterogeneities of the reservoir rocks. The NMR T2 spectrum can provide insight into the pore structure and pore size distributions in porous sandstones. The NMR method can produce a true fractal analysis (Zhou et al., 2016). The approach proposed in this paper can be used to evaluate fractal dimensions from NMR measurements satisfactorily, and the derived fractal dimensions have an advantage in quantifying the complexity and heterogeneity of pore structure.
Conclusions
Based on the present work, the following conclusions can be drawn.
Only minor primary intergranular porosity remains in the Chang 7 tight shaly sandstones, whereas variable amounts of secondary intragranular pores or micropores with poor connectivity are presented. The number of pores increase with progressive diagenesis, and pores become more spherical because of the extensive diagenetic modifications the Chang 7 sandstones experienced. Spherical pores are assumed in this study, and then the NMR T2 distributions can be converted to pore size distributions. Therefore, the numbers of pores greater than ri (T2i) and N(r) can be derived from the NMR measurements, and then the fractal dimension can then be calculated from the slope of the regression line in the log–log plot of N(r) against pore radius r.
The samples with bimodal behaviors and high content of long components (T2l) have the lowest fractal dimension, whereas samples with unimodal T2 distribution behaviors and high content of short components (T2s) have the highest fractal dimension and microscopic heterogeneity, which indicates that micropores are the primary cause of heterogeneity and irregularity in tight sandstones.
The SDR method can be used to derive the NMR permeability under net confining pressure of 800 psi. The NMR parameters T2cutoff and T2gm are macroscopic consequences of the microscopic pore structure. Regression analysis shows that the calculated fractal dimension is strongly correlated with T2peak and T2gm. The approach proposed in this paper can be used to calculate the fractal dimensions from laboratory NMR measurement data, and the derived fractal dimensions can be used to evaluate the complexity and heterogeneity of the porous rock satisfactorily.
References Cited
Anovitz, L. M., D. R. Cole, G. Rother, L. F. Allard, A. J. Jackson, and K. C. Littrell, 2013, Diagenetic changes in macro- to nano-scale porosity in the St. Peter Sandstone: An (ultra) small angle neutron scattering and backscattered electron imaging analysis: Geochimica et Cosmochimica Acta, v. 102, p. 280–305, doi:10.1016/j.gca.2012.07.035.
Broseta, D., L. Barré, O. Vizika, N. Shahidzadeh, J. P. Guilbaud, and S. Lyonnard, 2001, Capillary condensation in a fractal porous medium: Physical Review Letters, v. 86, no. 23, p. 5313–5316, doi:10.1103/PhysRevLett.86.5313.
Bu, H., Y. Ju, J. Tan, G. Wang, and X. Li, 2015, Fractal characteristics of pores in non-marine shales from the Huainan coalfield, eastern China: Journal of Natural Gas Science and Engineering, v. 24, p. 166–177, doi:10.1016/j.jngse.2015.03.021.
Cai, J., B. Yu, M. Zou, and M. Mei, 2010, Fractal analysis of invasion depth of extraneous fluids in porous media: Chemical Engineering Science, v. 65, p. 5178–5186, doi:10.1016/j.ces.2010.06.013.
Cao, Z., G. D. Liu, B. L. Xiang, P. Wang, G. Niu, Z. C. Niu, C. Z. Li, and C. Y. Wang, 2016a, Geochemical characteristics of crude oil from a tight oil reservoir in the Lucaogou Formation, Jimusar Sag, Junggar Basin: AAPG Bulletin, v. 101, no. 1, p. 1–33.
Cao, Z., G. Liu, H. Zhan, C. Li, Y. You, C. Yang, and H. Jiang, 2016b, Pore structure characterization of Chang-7 tight sandstone using MICP combined with N2GA techniques and its geological control factors: Scientific Reports, v. 6, 36919, doi:10.1038/srep36919.
Chi, L., K. Cheng, and Z. Heidari, 2016, Improved assessment of interconnected porosity in multiple-porosity rocks by use of nanoparticle contrast agents and nuclear-magnetic resonance relaxation measurements: SPE Reservoir Evaluation & Engineering, v. 19, p. 95–107, doi:10.2118/170792-PA.
Clarkson, C. R., N. Solano, R. M. Bustin, A. M. M. Bustin, G. R. L. Chalmers, L. Hec, Y. B. Melnichenko, A. P. Radliński, and T. P. Blach, 2013, Pore structure characterization of North American shale gas reservoirs using USANS/SANS, gas adsorption, and mercury intrusion: Fuel, v. 103, p. 606–616, doi:10.1016/j.fuel.2012.06.119.
Coates, G. R., R. C. A. Peveraro, A. Hardwick, and D. Roberts, 1991, The magnetic resonance imaging log characterized by comparison with petrophysical properties and laboratory core data: SPE Annual Technical Conference and Exhibition, Dallas, Texas, October 6–9, 1991, SPE-22723-MS, 9 p., doi:10.2118/22723-MS.
Cook, J. E., L. B. Goodwin, and D. F. Boutt, 2011, Systematic diagenetic changes in the grain-scale morphology and permeability of a quartz-cemented quartz arenite: AAPG Bulletin, v. 95, no. 6, p. 1067–1088, doi:10.1306/11151010009.
Daigle, H., and A. Johnson, 2016, Combining mercury intrusion and nuclear magnetic resonance measurements using percolation theory: Transport in Porous Media, v. 111, p. 669–679, doi:10.1007/s11242-015-0619-1.
Daigle, H., A. Johnson, and B. Thomas, 2014a, Determining fractal dimension from nuclear magnetic resonance data in rocks with internal magnetic field gradients: Geophysics, v. 79, no. 6, p. D425–D431, doi:10.1190/geo2014-0325.1.
Daigle, H., B. Thomas, H. Rowe, and M. Nieto, 2014b, Nuclear magnetic resonance characterization of shallow marine sediments from the Nankai Trough, Integrated Ocean Drilling Program Expedition 333: Journal of Geophysical Research, v. 119, p. 2631–2650, doi:10.1002/2013JB010784.
Dillinger, A., and L. Esteban, 2014, Experimental evaluation of reservoir quality in Mesozoic formations of the Perth Basin (Western Australia) by using a laboratory low field nuclear magnetic resonance: Marine and Petroleum Geology, v. 57, p. 455–469, doi:10.1016/j.marpetgeo.2014.06.010.
Friesen, W. I., and R. J. Mikula, 1987, Fractal dimensions of coal particles: Journal of Colloid and Interface Science, v. 120, no. 1, p. 263–271, doi:10.1016/0021-9797(87)90348-1.
Gao, H., B. Yu, Y. Duan, and Q. Fang, 2014, Fractal analysis of dimensionless capillary pressure function: International Journal of Heat and Mass Transfer, v. 69, p. 26–33, doi:10.1016/j.ijheatmasstransfer.2013.10.006.
Giri, A., S. Tarafdar, P. Gouze, and T. Dutta, 2012, Fractal pore structure of sedimentary rocks: Simulation in 2-D using a relaxed bidisperse ballistic deposition model: Journal of Applied Geophysics, v. 87, p. 40–45, doi:10.1016/j.jappgeo.2012.09.002.
Glover, P. W. J., I. I. Zadjali, and K. A. Frew, 2006, Permeability prediction from MICP and NMR data using an electrokinetic approach: Geophysics, v. 71, no. 4, p. F49–F60, doi:10.1190/1.2216930.
Hansen, J. P., and A. T. Skjeltorp, 1988, Fractal pore space and rock permeability implications: Physical Review B: Condensed Matter and Materials Physics, v. 38, no. 4, p. 2635–2638, doi:10.1103/PhysRevB.38.2635.
Higgs, K. E., H. Zwingmann, A. G. Reyes, and R. H. Funnell, 2007, Diagenesis, porosity evolution, and petroleum emplacement in tight gas reservoirs, Taranaki basin, New Zealand: Journal of Sedimentary Research, v. 77, p. 1003–1025, doi:10.2110/jsr.2007.095.
Hu, Q., R. P. Ewing, and S. Dultz, 2012, Low pore connectivity in natural rock: Journal of Contaminant Hydrology, v. 133, p. 76–83, doi:10.1016/j.jconhyd.2012.03.006.
Ji, L., F. Meng, J. D. Schiffbauer, J. Xu, K. Yan, and J. Shu, 2008, Correlation between highly abundant oil-prone leiosphaerid acritarchs and hydrocarbon source rocks from the Triassic Yanchang Formation, eastern Gansu Province, northwestern China: Gondwana Research, v. 14, p. 554–560, doi:10.1016/j.gr.2008.04.006.
Jin, Y., H. B. Song, B. Hu, Y. Zhu, and J. Zheng, 2013, Lattice Boltzmann simulation of fluid flow through coal reservoir’s fractal pore structure: Science China. Earth Sciences, v. 56, p. 1519–1530, doi:10.1007/s11430-013-4643-0.
Katz, A. J., and A. H. Thompson, 1985, Fractal sandstone pores: Implications for conductivity and pore formation: Physical Review Letters, v. 54, p. 1325–1328, doi:10.1103/PhysRevLett.54.1325.
Kleinberg, R. L., W. E. Kenyon, and P. P. Mitra, 1994, Mechanism of NMR relaxation of fluids in rock: Journal of Magnetic Resonance. Series A., v. 108, no. 2, p. 206–214, doi:10.1006/jmra.1994.1112.
Krohn, C. E., 1988, Fractal measurements of sandstones, shales, and carbonates: Journal of Geophysical Research, v. 93, no. B4, p. 3297–3305, doi:10.1029/JB093iB04p03297.
Kulesza, S., and M. Bramowicz, 2014, A comparative study of correlation methods for determination of fractal parameters in surface characterization: Applied Surface Science, v. 293, p. 196–201, doi:10.1016/j.apsusc.2013.12.132.
Lai, J., and G. Wang, 2015, Fractal analysis of tight gas sandstones using high-pressure mercury intrusion techniques: Journal of Natural Gas Science and Engineering, v. 24, p. 185–196, doi:10.1016/j.jngse.2015.03.027.
Lai, J., G. Wang, Y. Chai, and Y. Ran, 2015a, Prediction of diagenetic facies using well logs: Evidences from upper Triassic Yanchang Formation Chang 8 sandstones in Jiyuan region, Ordos basin, China: Oil & Gas Science and Technology, v. 71, p. 1–23.
Lai, J., G. Wang, Y. Chai, Y. Ran, and X. Zhang, 2015b, Depositional and diagenetic controls on reservoir pore structure of tight gas sandstones: Evidence from lower Cretaceous Bashijiqike formation in Kelasu thrust belts, Kuqa depression in Tarim basin of west China: Resource Geology, v. 65, no. 2, p. 55–75, doi:10.1111/rge.12061.
Lai, J., G. W. Wang, M. Chen, S. N. Wang, Y. Chai, C. Cai, Y. C. Zhang, and J. L. Li, 2013a, Pore structures evaluation of low permeability clastic reservoirs based on petrophysical facies: A case study on Chang 8 reservoir in the Jiyuan region, Ordos Basin: Petroleum Exploration and Development, v. 40, no. 5, p. 606–614, doi:10.1016/S1876-3804(13)60079-8.
Lai, J., G. Wang, Z. Fan, J. Chen, S. Wang, Z. Zhou, and X. Fan, 2016b, Insight into the pore structure of tight sandstones using NMR and HPMI measurements: Energy & Fuels, v. 30, p. 10200–10214, doi:10.1021/acs.energyfuels.6b01982.
Lai, J., G. Wang, L. Huang, W. Li, Y. Ran, D. Wang, Z. Zhou, and J. Chen, 2015c, Brittleness index estimation in a tight shaly sandstone reservoir using well logs: Journal of Natural Gas Science and Engineering, v. 27, p. 1536–1545, doi:10.1016/j.jngse.2015.10.020.
Lai, J., G. Wang, Y. Ran, Z. Zhou, and Y. Cui, 2016a, Impact of diagenesis on the petrophysical properties of tight oil reservoirs: The case of Upper Triassic Yanchang Formation Chang 7 oil layers in Ordos Basin, China: Journal of Petroleum Science Engineering, v. 145, p. 54–65, doi:10.1016/j.petrol.2016.03.009.
Lai, J., G. Wang, Y. Zheng, W. Li, and C. Cai, 2013b, Method for calculating the fractal dimension of the pore structure of low permeability reservoirs: A case study on the Xujiahe formation reservoir in central Sichuan basin (in Chinese with English abstract): Journal of Northeast Petroleum University, v. 37, no. 1, p. 1–7.
Li, K., 2010a, Analytical derivation of Brooks–Corey type capillary pressure models using fractal geometry and evaluation of rock heterogeneity: Journal of Petroleum Science Engineering, v. 73, p. 20–26, doi:10.1016/j.petrol.2010.05.002.
Li, K., 2010b, More general capillary pressure and relative permeability models from fractal geometry: Journal of Contaminant Hydrology, v. 111, p. 13–24, doi:10.1016/j.jconhyd.2009.10.005.
Li, K., and R. N. Horne, 2006, Fractal modeling of capillary pressure curves for the Geysers rocks: Geothermics, v. 35, p. 198–207, doi:10.1016/j.geothermics.2006.02.001.
Li, R., T. Guzmics, X. Liu, and G. Xie, 2011, Migration of immiscible hydrocarbons recorded in calcite-hosted fluid inclusions, Ordos basin: A case study from Northern China: Russian Geology and Geophysics, v. 52, no. 11, p. 1491–1503.
Lyu, W. Y., L. B. Zeng, Z. Q. Liu, G. P. Liu, and K. W. Zu, 2016, Fracture responses of conventional logs in tight oil sandstones: A case study of the upper triassic Yanchang formation in southwest Ordos Basin, China: AAPG Bulletin, v. 100, no. 9, p. 1399–1417, doi:10.1306/04041615129.
Meng, M., H. Ge, W. Ji, and X. Wang, 2016, Research on the auto-removal mechanism of shale aqueous phase trapping using low field nuclear magnetic resonance technique: Journal of Petroleum Science Engineering, v. 137, p. 63–73, doi:10.1016/j.petrol.2015.11.012.
Mitchell, J., and E. J. Fordham, 2014, Contributed review: Nuclear magnetic resonance core analysis at 0.3 T: Review of Scientific Instruments, v. 85, 111502.
Müller-Huber, E., J. Schön, and F. Börner, 2016, Pore space characterization in carbonate rocks—approach to combine nuclear magnetic resonance and elastic wave velocity measurements: Journal of Applied Geophysics, v. 127, p. 68–81, doi:10.1016/j.jappgeo.2016.02.011.
National Development and Reform Commission, 2007, Specification for normalization measurement of core NMR parameter in laboratory: Chinese Standard SYT6490-2007, p. 1–15.
Nelson, P. H., 2009, Pore-throat sizes in sandstones, tight sandstones, and shales: AAPG Bulletin, v. 93, no. 3, p. 329–340, doi:10.1306/10240808059.
Nooruddin, H. A., M. E. Hossain, A. Hasan, and T. Okasha, 2014, Comparison of permeability models using mercury injection capillary pressure data on carbonate rock samples: Journal of Petroleum Science Engineering, v. 121, p. 9–22, doi:10.1016/j.petrol.2014.06.032.
Pape, H., and C. Clauser, 2009, Improved interpretation of nuclear magnetic resonance T1 and T2 distributions for permeability prediction: Simulation of diffusion coupling for a fractal cluster of pores: Pure and Applied Geophysics, v. 166, p. 949–968, doi:10.1007/s00024-009-0480-7.
Pape, H., J. E. Tillich, and M. Holz, 2006, Pore geometry of sandstone derived from pulsed field gradient NMR: Journal of Applied Geophysics, v. 58, p. 232–252, doi:10.1016/j.jappgeo.2005.07.002.
Rezaee, R., A. Saeedi, and B. Clennell, 2012, Tight gas sands permeability estimation from mercury injection capillary pressure and nuclear magnetic resonance data: Journal of Petroleum Science and Engineering, v. 88–89, p. 92–99.
Sakhaee-Pour, A., and W. Li, 2016, Fractal dimensions of shale: Journal of Natural Gas Science and Engineering, v. 30, p. 578–582, doi:10.1016/j.jngse.2016.02.044.
Schmitt, M., C. P. Fernandes, J. A. B. C. Neto, F. G. Wolf, and V. S. S. Santos, 2013, Characterization of pore systems in seal rocks using nitrogen gas adsorption combined with mercury injection capillary pressure techniques: Marine and Petroleum Geology, v. 39, p. 138–149, doi:10.1016/j.marpetgeo.2012.09.001.
Sigal, R. F., 2015, Pore-size distributions for organic-shale-reservoir rocks from nuclear-magnetic-resonance spectra combined with adsorption measurements: SPE Journal, v. 20, p. 824–830, doi:10.2118/174546-PA.
Wang, H., Y. Liu, Y. Song, Y. Zhao, J. Zhao, and D. Wang, 2012, Fractal analysis and its impact factors on pore structure of artificial cores based on the images obtained using magnetic resonance imaging: Journal of Applied Geophysics, v. 86, p. 70–81, doi:10.1016/j.jappgeo.2012.07.015.
Weller, A., Y. Ding, Z. Zhang, M. Kassab, and M. Halisch, 2016, Fractal dimension of pore space in carbonate samples from Tushka Area (Egypt): International Symposium of the Society of Core Analysts, Snowmass, Colorado, August 21–26, 2016, p. 21–26.
Wong, P., J. Howard, and J. S. Lin, 1986, Surface roughening and the fractal nature of rocks: Physical Review Letters, v. 57, p. 637–640, doi:10.1103/PhysRevLett.57.637.
Xu, S., and S. Wang, 2013, Fractal feature about the micro-structure in sandstone reservoir: Taking the Paleogene Shahejie Formation in Shengtuo oilfield as an example (in Chinese with English abstract): Natural Gas Geoscience, v. 24, no. 5, p. 886–893.
Yang, F., Z. Ning, and H. Liu, 2014, Fractal characteristics of shales from a shale gas reservoir in the Sichuan Basin, China: Fuel, v. 115, p. 378–384, doi:10.1016/j.fuel.2013.07.040.
Yang, Y., W. Li, and L. Ma, 2005, Tectonic and stratigraphic controls of hydrocarbon systems in the Ordos basin: A multicycle cratonic basin in central China: AAPG Bulletin, v. 89, no. 2, p. 255–269, doi:10.1306/10070404027.
Yao, Y. B., D. M. Liu, Y. Che, D. Z. Tang, S. H. Tang, and W. H. Huang, 2010, Petrophysical characterization of coals by low-field nuclear magnetic resonance (NMR): Fuel, v. 89, no. 7, p. 1371–1380, doi:10.1016/j.fuel.2009.11.005.
Zeng, L. B., and X. Y. Li, 2009, Fractures in sandstone reservoirs with ultra-low permeability: A case study of the Upper Triassic Yanchang Formation in the Ordos Basin, China: AAPG Bulletin, v. 93, no. 4, p. 461–477, doi:10.1306/09240808047.
Zhang, Z., and A. Weller, 2014, Fractal dimension of pore-space geometry of an Eocene sandstone formation: Geophysics, v. 79, no. 6, p. D377–D387, doi:10.1190/geo2014-0143.1.
Zhou, L., and Z. Kang, 2016, Fractal characterization of pores in shales using NMR: A case study from the lower Cambrian Niutitang Formation in the Middle Yangtze Platform, southwest China: Journal of Natural Gas Science and Engineering, v. 35, p. 860–872, doi:10.1016/j.jngse.2016.09.030.
Zhou, S., D. Liu, Y. Cai, and Y. Yao, 2016, Fractal characterization of pore–fracture in low-rank coals using a low-field NMR relaxation method: Fuel, v. 181, p. 218–226, doi:10.1016/j.fuel.2016.04.119.
Zou, C., R. Zhu, K. Liu, L. Su, B. Bai, X. Zhang, X. Yuan, and J. Wang, 2012, Tight gas sandstone reservoirs in China: Characteristics and recognition criteria: Journal of Petroleum Science Engineering, v. 88–89, p. 82–91, doi:10.1016/j.petrol.2012.02.001.
Acknowledgments
We thank PetroChina Changqing Oilfield Company for providing samples and data access. This work was financially supported by the National Natural Science Foundation of China (grant 41472115) and National Science & Technology Major Project of China (grants 2011ZX05020-008 and 2016ZX05019-005-006), and we thank the sponsors of these projects. We thank PetroChina Research Institute of Petroleum Exploration Development for their data and technological support. We are indebted to Mahmood Shakiba and an anonymous reviewer for their constructive comments, which improved the paper significantly. We thank AAPG staff members, Paula Sillman, Andrea Sharrer, and Frances Plants Whitehurst, for their kind work on this paper. We also thank Barry J. Katz, the AAPG Editor, for his enthusiasm, patience, and tireless efforts.