ABSTRACT
Low-rank coal reserves account for nearly 55% of the national coal reserves in China, and it is extremely important to understand their anisotropic microstructure and coalbed methane storage and sorption characteristics. In this study, microstructures that develop parallel to and perpendicular to bedding of low-rank coals are studied through scanning electron microscopy. The micromorphology and microfracture and mineral distributions are examined. Based on fractal theory and digital image processing technology, the fractal box-counting dimensions of microfracture distributions that form parallel as well as perpendicular to the coal bedding planes are calculated, and the anisotropic fractal characteristics of these microfracture distributions are characterized. The pore-size distribution and the fractal characteristics of the microscopic pore structure are systematically examined by means of nitrogen adsorption and mercury intrusion tests. The results of the fractal box-counting dimension calculations indicate that microfractures distributed perpendicular to coal bedding are rougher and more irregular than those distributed along a bedding plane, with the former exhibiting higher space filling and methane adsorption capacity. The fractal dimension of the microscopic pore structure reveals two inflection points measuring approximately 5 and 80 nm, thereby indicating that the low-rank coal exhibits a microscopic pore structure with a three-level fractal characteristic.
INTRODUCTION
Coal is typically a double-porosity medium that is full of cleats or fractures and pores in the matrix. The macrostructure of coal is extremely complex. Studies on coal microstructure forms the foundation of studies on coalbed methane (CBM) accumulation and migration and gas adsorption/desorption (Tomita et al., 1981; Karacan and Okandan, 2001; Mosher et al., 2013; Mostaghimi et al., 2015; Liu and Nie, 2016; Fu et al., 2017; Liu and He, 2017). The pore structure of coal is a significant factor in CBM storage and diffusion or permeation (Smith and Williams, 1984, 1987; Cai et al., 2013; Nie et al., 2016; Zhao et al., 2017).
In 1974, scanning electron microscopy (SEM) was introduced by Messier (1974), and it has become widely used in the study of rock microscopic morphology. Micro- and meso-imaging technologies significantly contributed to the observation of coal micromorphology characteristics (Neupane et al., 2017). Giffin et al. (2013) examined the morphology and distribution of macro- and mesopores by using broad ion beam milling to prepare low-relief polished surfaces of coal samples for high-resolution SEM imaging. Karacan and Okandan (2001) combined x-ray computed tomography (CT) imaging technology and SEM to observe and evaluate differences in gas migration velocity and adsorption velocity among coals with different types of microstructures. Two different rank coals (the maximum vitrinite reflectance (Ro,max) of 0.4% and 0.85%, respectively) from the southern Junggar basin in northwestern China were systematically investigated by Zhou et al. (2017) to characterize pore-fracture spaces and their nanoscale connectivity in three dimensions by using focused ion beam-SEM tomography. Liu and He (2017) investigated the influence of pore structure characteristics of different rank coals on CBM adsorption by using Fourier transform infrared spectroscopy, low-pressure nitrogen gas adsorption, and SEM. Zhou et al. (2018) investigated the evolution of fracture networks in coal during loading using x-ray microcomputed tomography with a uniaxial compression facility. In recent years, because of the rapid development of computer technology and digital image processing technology (DIPT), the microstructure characteristics of rock can be quantitatively studied (Xu et al., 2008; Chen et al., 2009). However, the anisotropic characteristics of the micromorphology and microfracture distribution of coals have not been well studied and especially by means of DIPT.
The microscopic pore structure of coal is highly complicated, and pore types and size distribution directly impact the methane adsorption/desorption capability (Faiz et al., 1992; Laxminarayana and Crosdale, 1999; Liu and He, 2017). The microscopic pore structure changes with coal rank, with low-rank coal typically exhibiting higher porosity, more meso- and macropores, and good pore connectivity, thereby leading to better permeability (Thomas and Damberger, 1976; Faiz et al., 1992; Laxminarayana and Crosdale, 1999; Cai et al., 2013; Nie et al., 2015; Rahmat et al., 2015; Liu and He, 2017). Coal generally tends to be nonuniform in terms of both surface and internal structure. Internal pore structures often widely vary in size and shape. This nonuniformity is a decisive factor in gas sorption (Jaroniec, 1983) and, therefore, should be considered apart from factors including the specific surface area and pore-size distribution while interpreting the microstructure of coals.
Studies indicate that microscopic pore structure and surface morphology exhibit a statistical fractal feature and are thereby better depicted by fractal geometry as opposed to Euclidean geometry (Mandelbrot, 1982; Friesen and Mikule, 1987). Fractal geometry, created by Mandelbrot in 1982, investigates irregular objects and phenomena that demonstrate self-similarity. Poulton et al. (1990) suggested that the fractal dimension is an important rock mass mechanics indicator, from which rock mass characteristics can be accurately described. Pfeifer and Avnir (1983) held that the fractal dimension is related to the smoothness of pore surface, and the closer the fractal dimension is to 2.0, the smoother the pore surface is; conversely, the closer the fractal dimension is to 3.0, the rougher the pore surface is. In recent years, the fractal theory has developed rapidly (Wang et al., 2017).
Nitrogen adsorption and mercury intrusion tests are important and widely used techniques to characterize the pore structure and its fractal characteristics in a variety of porous materials (Gan et al., 1972; Clarkson and Bustin, 1999; Mahamud et al., 2003; Yao and Liu, 2006; Mastalerz et al., 2008; Cai et al., 2011; Cardott and Curtis, 2018; Mahamud and García, 2018). Based on the results of mercury intrusion, nitrogen adsorption at 77 K (∼ −196°C or −321°F) and small-angle x-ray scattering, Cai et al. (2013) concluded that an increase in the irregularity of the surface makes the pore structure more inhomogeneous, and this results in the availability of a higher surface area for adsorption.
Different testing methods exhibit their own scope of application based on their test principles. The mercury intrusion test is based on the gradual injection of liquid mercury into an evacuated pore system using external forces. Increases in the pressure make smaller pores accessible to the mercury (Ritter and Drake, 1945). Measurements typically run up to a maximum pressure of 35 MPa (∼5076 psi) at which pore throats as low as 0.018 μm can be penetrated. Li et al. (1999) indicated that coal compressibility significantly affects mercury porosimetry results, especially when the pressure exceeds 20 MPa (∼2901 psi) and the corresponding pore diameter is approximately 60 nm. However, different studies obtained different threshold pressures or pore diameters. Toda and Toyoda (1972) concluded that the evident increase in mercury uptake by coal is entirely due to the compression and crushing of the coal structure when the pressure exceeds 10 MPa (∼1450 psi). Similar conclusions were obtained by Suuberg et al. (1995). Friesen and Ogunsola (1995) and Mahamud et al. (2003) indicated that coal-matrix compression began to occur at a higher pressure (>13 MPa [∼1885 psi]) and that the fractal dimension was greater than 3, and this did not satisfy the fractal characteristics of coal reservoirs under natural conditions. The finding is observed potentially because the coal internal structure is compressed or crushed under high intrusion pressures applied during the mercury intrusion tests, which results in the inaccuracy of pore-size data (Li et al., 1999; Comisky et al., 2011). Specifically, low-rank coal generally exhibits larger porosity when large injection pressures can significantly damage the microscopic pore structure. However, nitrogen adsorption is controlled by capillary condensation at high relative pressures (Brunauer et al., 1940) and thus does not cause significant damage to the microscopic pore structure (Mahnke and Mögel, 2003; Yao et al., 2008; Cai et al., 2013). Therefore, the nitrogen adsorption test is more accurate than mercury intrusion for smaller pore-size distributions (Comisky et al., 2011; Cai et al., 2013). Using both of these complementary techniques allows for accurate measurement of pore-size distributions over a wide range of sizes (Clarkson and Bustin, 1999; Qi et al., 2002; Radlinski et al., 2004; Yao et al., 2008).
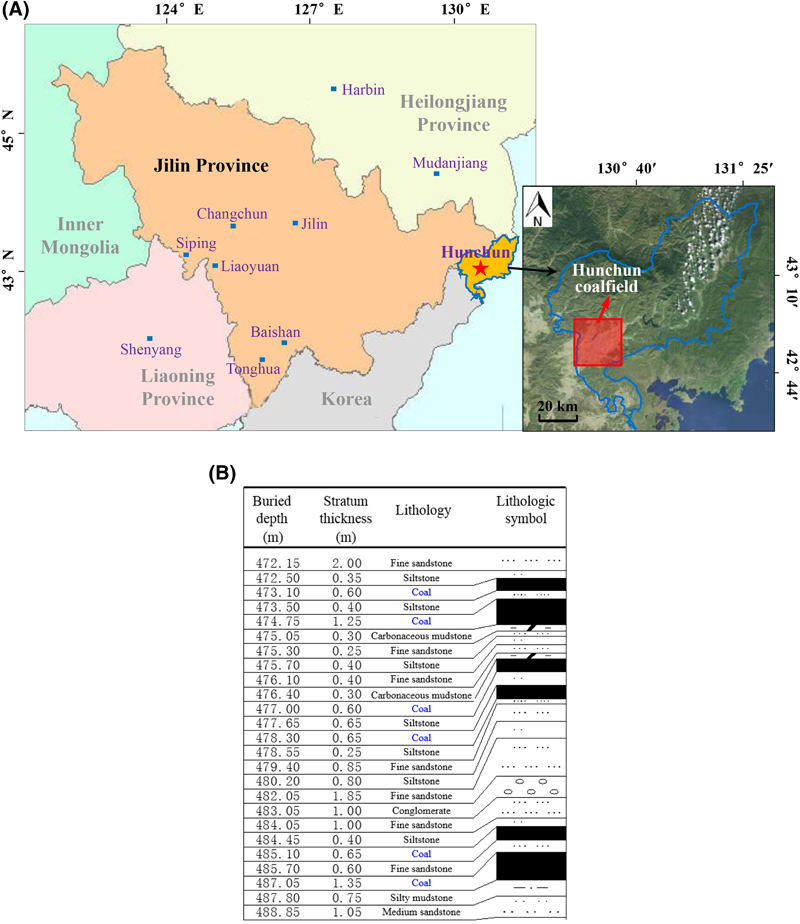 Figure 1. The index map (A) and stratigraphic column (B) from 470 to 490 m (1541 to 1607 ft) in depth.
In this study, microstructures that develop parallel to and perpendicular to bedding of low-rank coal obtained from the Hunchun coalfield in the Jilin province of China are examined through SEM. The index map is shown in Figure 1. Specifically, the micromorphology, microfracture, and mineral distributions are investigated. Based on fractal theory and DIPT, the fractal box-counting dimensions of the microfracture distribution are calculated for both the bed parallel and perpendicular directions. The anisotropic fractal characteristics of the microfracture distribution are subsequently analyzed based on the aforementioned calculations. Finally, the pore-size distribution of coal and the fractal characteristics of its microscopic pore structure are studied by means of nitrogen adsorption and mercury intrusion tests. Research methods in this study provide a reference for the microstructure study on other ranks of coal.
INTRODUCTION OF THE STUDIED COAL
The low-rank coal (long flame coal) was obtained from the Hunchun coalfield in Jilin province of China. With developed multiple minable coal seams, the regional structural characteristics of the Hunchun coalfield are relatively simple and clear. The stratigraphic column is shown in Figure 1B. The largest proportion of coal in the 26th coal seam is semibright coal. The average bulk density is 1340 kg/m3 (∼84 lb/ft3). Different coal quality indicators were obtained by specialized testing methods. The reflected polarizing microscope test is a commonly used method to determine the contents of various macerals (the vitrinite, semivitrinite, inertinite, exinite) by count maceral points under the condition of incomplete orthogonal polarization or single polarization. The moisture (air dry basis) and volatile matter (dry ash-free basis) contents of coal were obtained by the automatic industrial testing instrument. The ash yield (air dry basis) and the gross calorific value (air dry basis) were tested by the ash content testing instrument and coal calorific value measuring instrument, respectively.
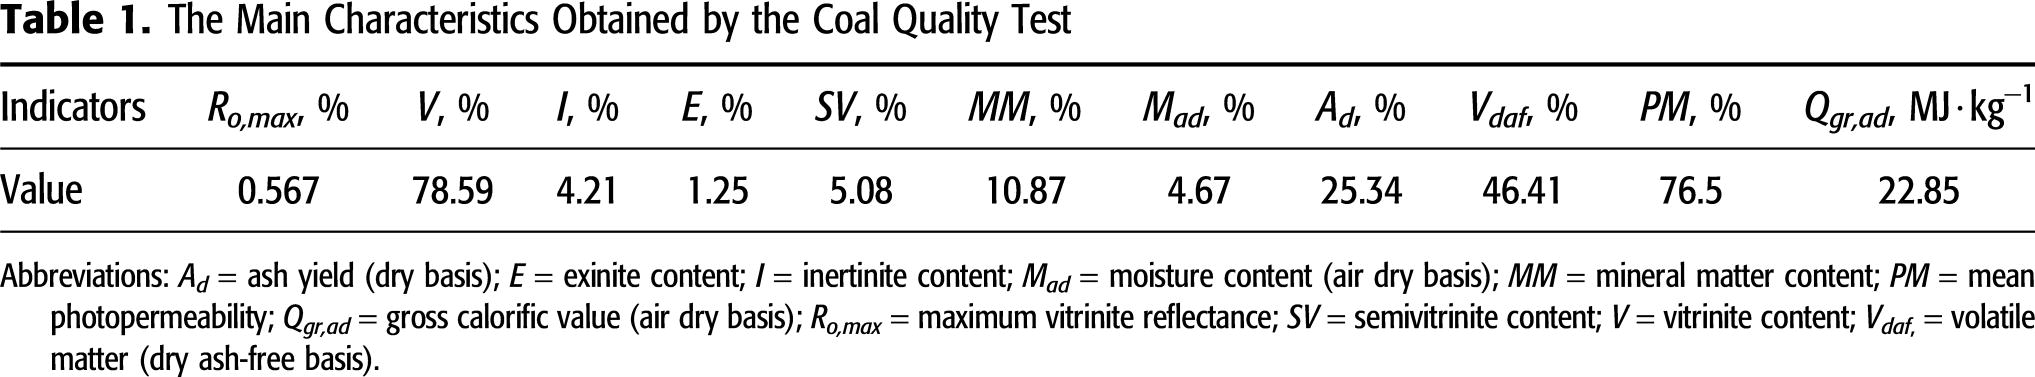
The majority of macerals are vitrinite, at 78%, whereas the proportions of inertinite and exinite are 4% and 1%, respectively; the Ro,max is 0.6%. The Ro,max of coal increases with buried depth, rising 0.05% every 100 m (∼328 ft). The basic characteristics obtained during the coal quality tests are summarized in Table 1. Figure 2 shows a photograph of the coal in which a variety of cleats or fractures are visible.
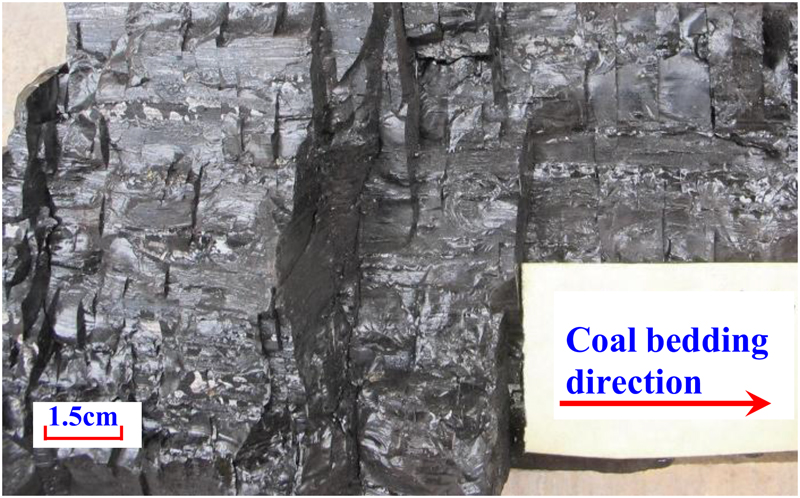 Figure 2. Low-rank coal sample photo.
MICROMORPHOLOGY INVESTIGATION BASED ON SCANNING ELECTRON MICROSCOPY
Scanning Electron Microscopy Method
In SEM, focused electron beams are used to scan an image point-by-point on the surface of the sample, and two different imaging modes are possible, namely secondary electron mode (ETD) and backscattered electron diffraction mode (BSED). The contrast of an ETD image is mainly due to surface topography, and thus it exhibits a strong three-dimensional effect. However, ETD images do not provide information on sample composition. It should be noted that the contrast of a BSED image is mainly due to local differences in average atomic weight. Different minerals exhibit different levels of brightness or color in a BSED image from which qualitative compositional information can be extracted. In this study, ETD and BSED are combined to investigate the properties of coal microstructure.
 Figure 3. Scanning electron microscopy images observed parallel to coal beddings in (A) secondary electron mode and (B) backscattered electron diffraction mode. σ = speculated in situ principle stress.
The Quanta 250 scanning electron microscope produced by American FEI was used. The resolution is 3.0 nm when the voltage is 30 kV for the ETD mode and 4.0 nm for the BSED mode.
Micromorphology Observation Results
Figures 3 and 4 show the SEM images taken parallel to and perpendicular to coal beddings, respectively. The additional delineations shown in Figures 3A and 4A and Figures 3B and 4B denote images observed at the same location but with different SEM electron modes (ETD and BSED, respectively). As shown in Figures 3A and 4A, differences in brightness imply regions of irregularity and unevenness on the coal surface. Conversely, in Figures 3B and 4B, differences in brightness mainly imply regions with different compositions. The white spots in Figures 3B and 4B are mostly minerals that normally fill fractures or bedding planes. As shown in Figure 3, a variety of microfractures are distributed along a bedding plane, with most displaying an X-shaped pattern. The microfractures in direction 1 are denser than those in direction 2, which suggests a connection with the in situ stress state. Specifically, “σ” in Figure 3B is the speculated direction of principle in situ stress. However, the relation between microfracture morphological characteristics and the stress that the coal previously suffered by the coal should be further examined and verified.
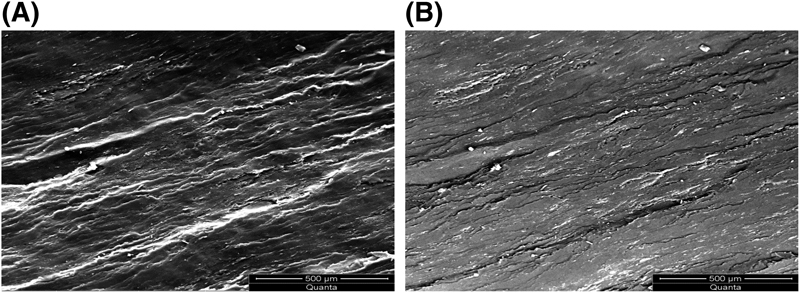 Figure 4. Scanning electron microscopy images observed perpendicular to coal beddings in (A) secondary electron mode and (B) backscattered electron diffraction mode.
Figure 5 shows the minerals that fill in the fractures or bedding planes, with Figure 5A being an image along bedding and Figure 5B showing an image that is perpendicular to the bedding. The image is observed with the BSED mode. Most minerals are characterized as having a floccular structure, as shown in the rectangles in Figure 5. It is speculated that the floccular minerals in coal mainly correspond to clay minerals (Gamson et al., 1993 and Giffin et al., 2013), calcite (CaCO3), kaolinite (Al2Si2O5(OH)4), and illite (KAl2(Si3Al)O11(OH)2).
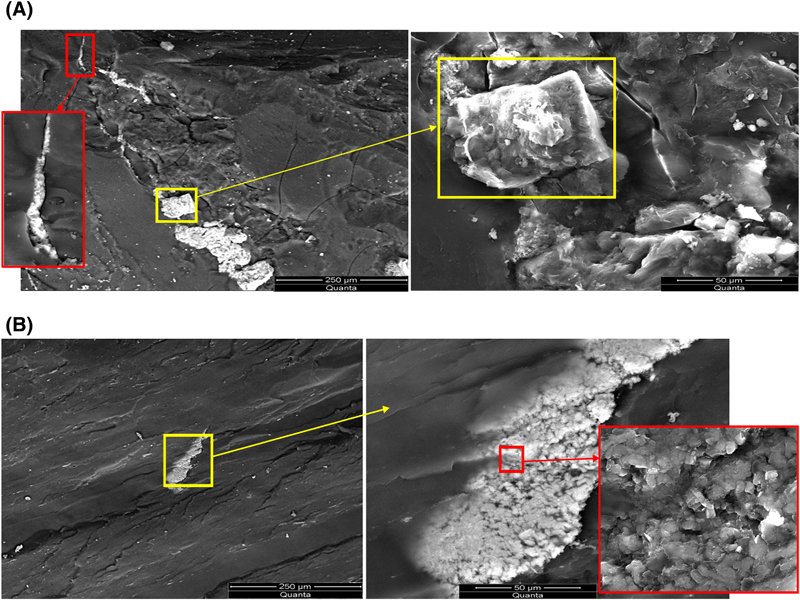 Figure 5. Minerals that filled in the fractures or bedding planes (backscattered electron diffraction mode): (A) scanning electron microscopy image observed parallel to coal beddings; (B) scanning electron microscopy image observed perpendicular to coal beddings.
Digital Image Processing Technology Investigation Results
A digital image is composed of a variety of points with different pixels, and each pixel point exhibits its own color. The pixels in a binary digital image are only black and white and are represented with “1” and “0” in the matrix, respectively, and the corresponding gray values are 0 and 255.
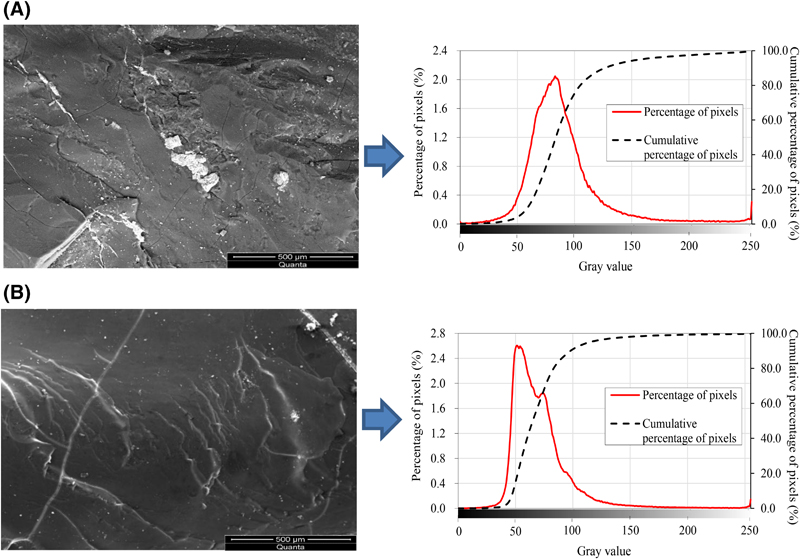 Figure 6. The percentages of the pixel points with different gray values in digital images observed parallel to coal beddings.
The color of minerals significantly differs from that of the coal matrix in BSED mode images. Minerals are white with higher brightness, whereas the coal matrix is dark. Thus, the gray values of the minerals’ pixel points are higher, and those of the matrix’s pixel points are significantly low. The percentages of the pixel points with different gray values in the digital images that are observed parallel to the coal bedding are shown in Figure 6. Figure 7 shows the percentages of the pixel points with different gray values in digital images that are observed perpendicular to the coal bedding.
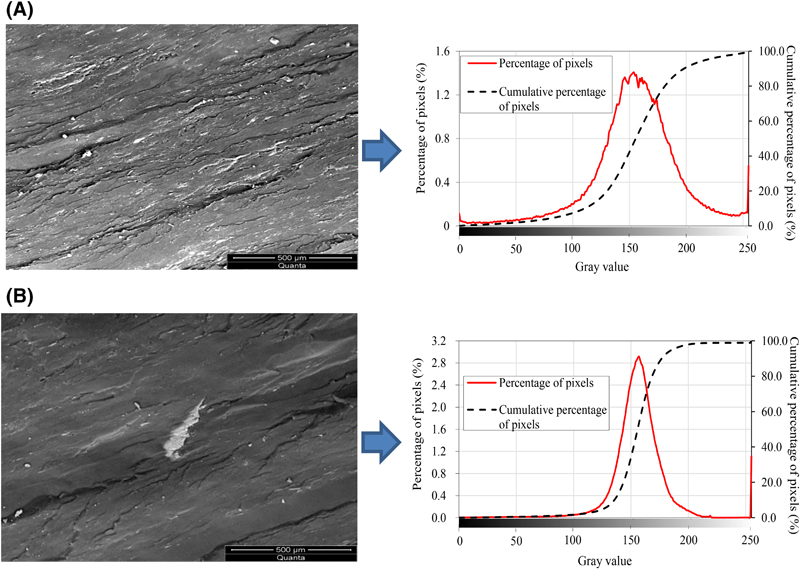 Figure 7. The percentages of the pixel points with different gray values in digital images observed perpendicular to coal beddings.
The highest percentage of pixel points in a surface that parallels bedding appears near the gray value of 80, and the highest percentage of pixel points in a surface that is perpendicular to bedding appears near the gray value of 155. The mineral content (the gray value is ∼245–255) on a surface that is perpendicular to the bedding is higher than that parallel to bedding. To extract the mineral content, the images observed by SEM are processed into binary digital images using the appropriate gray threshold values. During the actual calculation process, the computer automatically provides a reference gray value based on the maximum entropy thresholding segmentation algorithm to ensure the clarity of target features. The maximum entropy thresholding segmentation algorithm was first proposed by Kapur et al. (1980) and applied to two-dimensional digital images by Abutaleb (1989) and Brink (1992). When the total entropy of the background pixels and the target pixels reaches the maximum, it is considered that the image segmentation reaches the best effect, and the threshold at this time is considered optimal. The mathematical calculation process of the maximum entropy can be found in numerous works (Brink, 1992; Zhang et al., 2012; Bhandari et al., 2015). This paper does not discuss this calculation in detail. Zhou et al. (2018) obtained the grayscale histogram of a CT image of the coal specimen, and the threshold gray values of the pore fracture and coal matrix were obtained using the maximum entropy method. As shown in Figure 8, the white denotes the minerals, whereas the black denotes the coal matrix. The gray threshold values for the binary digital image observed parallel to the coal bedding are 0.5774 and 0.5823, whereas those perpendicular to the coal bedding are 0.7912 and 0.7741. The digital images shown in Figure 8 indicate that the percentages of minerals on the surface that are parallel to coal bedding are approximately 6.14% and 5.76% with an average value of 5.95%; those in surfaces perpendicular to the coal bedding are approximately 8.87% and 8.49%, with an average value of 8.68%.
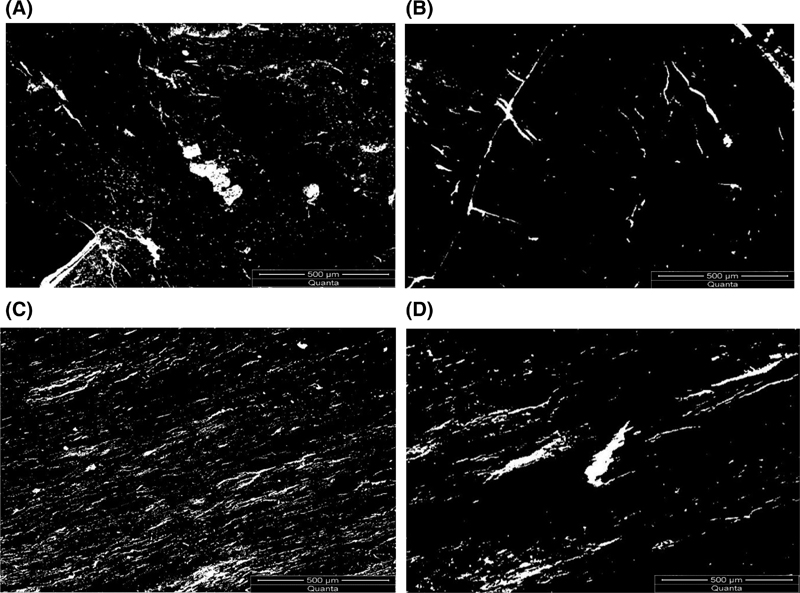 Figure 8. The binary digital images of minerals and coal matrix. (A, B) Results of images observed parallel to coal beddings. (C, D) Results of images observed perpendicular to coal beddings.
The color of the microfractures also significantly differs from that of the other components (the matrix and minerals) in the BSED mode images. The microfractures are extremely dark because of depressions, and their gray value is extremely low such that it is close to 0. To distinguish the fractures from the matrix and minerals, the binary digital images that are shown in Figure 9 are obtained by selecting appropriate gray threshold values. The gray threshold values of digital images observed parallel to the coal bedding are 0.1497 and 0.1473, whereas the gray threshold values of digital images observed perpendicular to the coal bedding are 0.2134 and 0.2047.
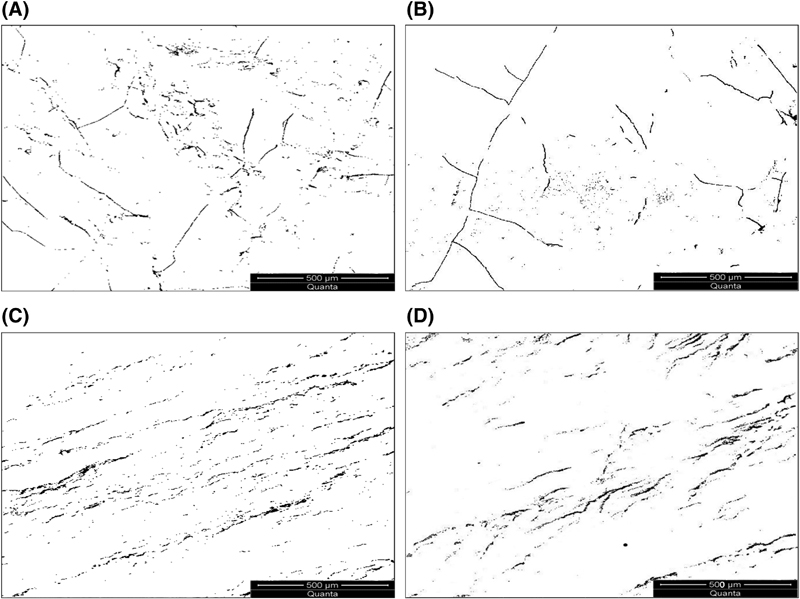 Figure 9. The binary digital images of microfractures. (A, B) Results of images observed parallel to coal beddings. (C, D) Results of images observed perpendicular to coal beddings.
FRACTAL CHARACTERISTICS OF MICROFRACTURES
The box-counting method is often used for image fractal dimension estimation (Ai et al., 2014; Liu et al., 2015; Nayak et al., 2018). It includes several advantages such as the convenience of implementation, high computing efficiency, reasonable calculation results, and the applicability for the images with or without self-similarity (Di et al., 2007; Tang et al., 2012; Azemin et al., 2015; Liu and Nie, 2016; Nabelek et al., 2018; Nayak et al., 2018).
The fractal box-counting dimension can be obtained by equation 1 (Fu et al., 2006; Liu et al., 2015)
where A is an arbitrary bounded set in  space. With respect to an arbitrary r greater than 0, the minimum required number of N-dimensional boxes with the square of r that is used to cover A is
  . Plotting of [
 ,
, ] in the logarithmic coordinate system with
  as the abscissa and
  as the ordinate permits the use of the absolute value of the slope of the fitting line of these points to define the fractal box-counting dimension of set A.
The fractal box-counting dimensions of microfractures are calculated based on fractal theory (Fu et al., 2006; Liu et al., 2015; Nayak et al., 2018). Microfractures are covered with square boxes with sizes ranging from small to large, and the minimum required number is counted. The covering process of the microfractures distributed on a surface that is perpendicular to coal beddings is shown in Figure 10. Figure 10A–D, respectively, shows different results when the microfractures are covered with boxes with sizes ranging from small to large and when the number of required boxes gradually decreases.
 Figure 10. Microfractures are covered with square boxes in varied sizes from small to large (the surface that is perpendicular to coal beddings): (A) box number is 2300; (B) box number is 1500; (C) box number is 800; (D) box number is 300.
The microfractures distributed in a surface that parallels coal bedding are processed in the same manner. Figures 11 and 12 show the points of [ ,
, ] and fitting lines in the logarithmic coordinate system with
  as the abscissa and
  as the ordinate.
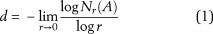
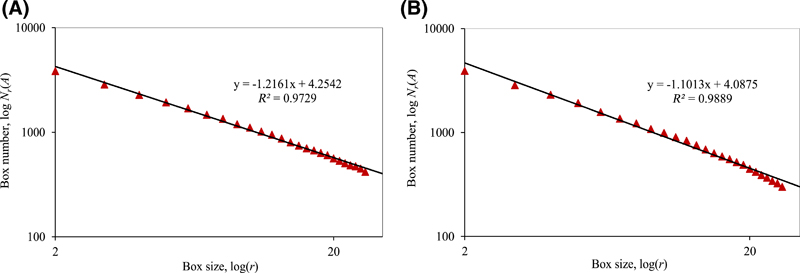 Figure 11. >Fractal box-counting dimension fitting process of surfaces that are parallel to coal beddings: (A) result of Figure 9A; (B) result of Figure 9B. r = side length of the square box; Nr(A) = minimum required number of boxes used to cover A (arbitrary bounded set in Rn space); R2 = coefficient of determination.
Fractal box-counting dimensions are calculated with equation 1. The results indicate that the fractal box-counting dimensions of microfractures distributed in surfaces that are parallel to coal bedding are 1.22 and 1.10, with an average value of 1.16. Conversely, those of microfractures distributed on surfaces that are perpendicular to coal bedding are 1.33 and 1.31, with an average value of 1.32.
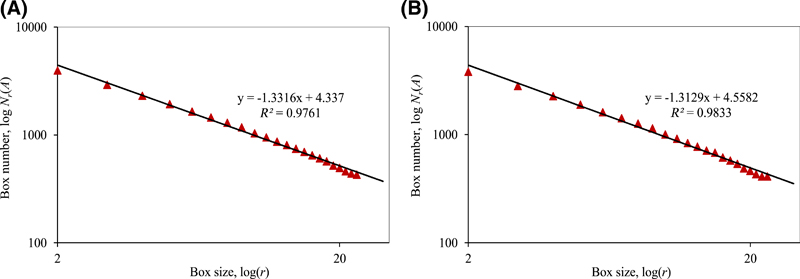 Figure 12. Fractal box-counting dimension fitting process of surfaces that are perpendicular to coal beddings: (A) result of Figure 9C; (B) result of Figure 9D. Nr(A) = minimum required number of boxes that are used to cover A (arbitrary bounded set in Rn space); R2 = coefficient of determination.
Fractal box-counting dimension characterizes the nonuniformity, roughness, and irregularity of microfractures in a surface. The space filling capacity and methane adsorption capacity of coal are also reflected (Liu and Nie, 2016). The larger the fractal box-counting dimension, the more inhomogeneous and irregular the structure is (Pfeifer and Avnir, 1983; Krohn and Thompson, 1986; Xie, 1996). Our results from the fractal box-counting dimension indicate that the microfractures distributed in a surface that is perpendicular to coal bedding are rougher and more irregular when compared to those distributed in a bedding plane, and the former exhibit higher space filling and methane adsorption capacity.
FRACTAL CHARACTERISTICS OF MICROSCOPIC PORE STRUCTURE
Test Methods
Nitrogen Adsorption Test
The nitrogen adsorption test is based on the gas adsorption law on the surface of solid pore structure to determine the pore specific surface area and pore-size distribution (Schmitt et al., 2013; Qi et al., 2017).
Pore-size distribution characteristics of less than 89.19 nm were examined through the nitrogen adsorption test. The NOVA1000e-pore diameter distribution testing instrument produced by Quantachrome was used. Based on the classical gas adsorption method and various structural analysis models, the gas is injected into a vacuum and confined space in which the sample was placed by an automatic gas feeding method. The gas isothermal adsorption curve, specific surface area of the sample, porosity, and true density are obtained. The pressure sensor accuracy is less than ±0.1%, and the ultimate vacuum is 1 × 10⁻³ P/P0 (P is the adsorption pressure, and P0 denotes saturated vapor pressure of nitrogen). The samples required for the nitrogen adsorption test are rectangular blocks with a side length of approximately 3.0 mm (∼0.1 in.).
Mercury Intrusion Test
The mercury intrusion test is based on the gradual injection of liquid mercury into an evacuated pore system with external pressures (Li et al., 1999). The testing method of the mercury intrusion test is based on the Washburn equation that conforms to the nonwetting capillary principle (Porcheron et al., 2004). The amount of mercury injected into the degassed solid pores under external pressure is converted into pore size and surface area for different pores, and the distribution information of pore size is obtained based on the applied pressure (Kaufmann et al., 2009).
 Figure 13. Nitrogen adsorption test results. P = adsorption pressure; P0 = saturated vapor pressure of nitrogen; STP = standard temperature and pressure (which is defined by the international union of pure and applied chemistry).
The pore-size distribution characteristics within the range of 3.51 nm to 180.9 μm were examined through the mercury intrusion test. A Poremaster33 high-pressure pore structure instrument produced by Quantachrome was used. High-precision pressure sensors and the standard volume expansion meter were used to measure the intrusion and withdrawal curves. The pore-size distribution, porosity, and true density were obtained. The pressure range was 0.0016–227.53 MPa (∼0.23–33,000.00 psi), and the sensor precision was ±0.11%. The samples required for the mercury intrusion test were rectangular blocks with a side length of less than 1.0 cm (∼0.4 in.).
Nitrogen Adsorption Test Results and Fractal Characterization
The experimental results are shown in Figure 13. The unit of sorption volume is  (1.0 ml = 0.03 oz). The adsorption–desorption curve exhibits an evident hysteresis loop when the relative pressure increases (P/P0 > 0.5), and the adsorption and desorption curves almost coincide under decreased pressure. The results demonstrate that several shrinkage pores (ink bottle-shaped pores) exist in the coal and result in evident capillary condensation (Khalili et al., 2000; Qi et al., 2002; Sing, 2004).
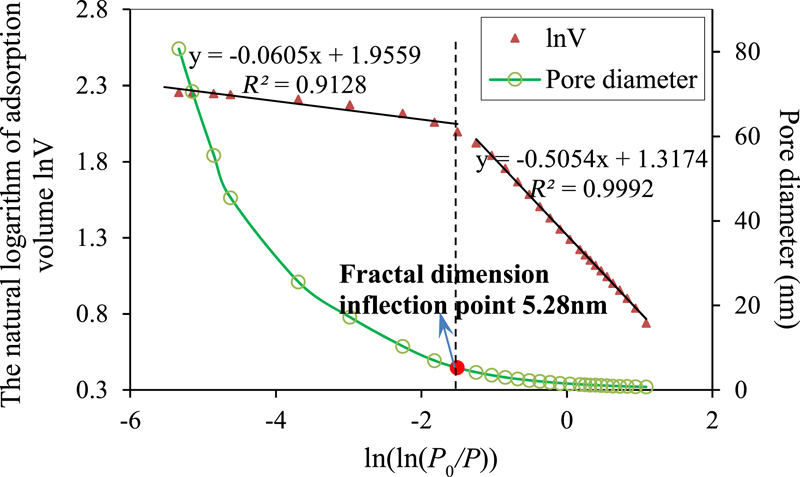 Figure 14. Nitrogen adsorption test results of sample NQ-1. P = adsorption pressure; P0 = saturated vapor pressure of nitrogen; R2 = coefficient of determination.
Pfeifer and Avnir (1983) proposed a fractal dimension calculation method based on the Frenkel–Halsey–Hill (FHH) model. In the multilayer adsorption region, the adsorption relative pressure P/P0 and adsorption volume V conform to the FHH equation. Generally, the relative pressure range of this region is 0–0.9. The fractal dimension of the microscopic pore structure of a porous medium is directly calculated from the FHH equation (Amarasekera et al., 1995; Jarz̧bski et al., 1995; Cerofolini and Meda, 1998). The FHH equation is expressed as

where V denotes the adsorbed volume when equilibrium pressure is P, P0 denotes saturated vapor pressure of nitrogen, C is a constant, and S denotes a constant related to the gas adsorption mechanism and fractal dimension.
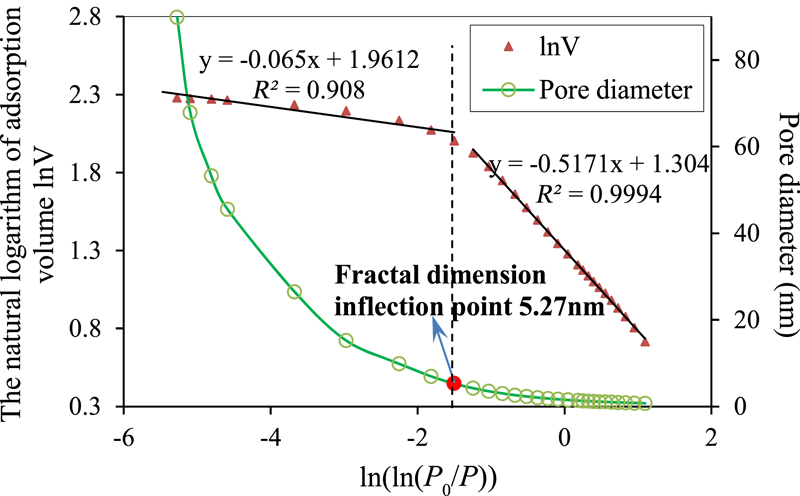 Figure 15. Nitrogen adsorption test results of sample NQ-2. P = adsorption pressure; P0 = saturated vapor pressure of nitrogen; R2 = coefficient of determination.
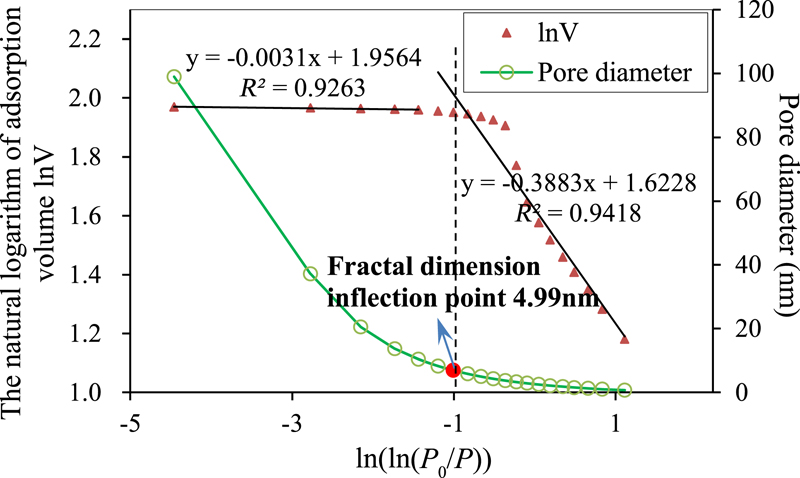 Figure 16. Nitrogen adsorption test results of sample NQ-3. P = adsorption pressure; P0 = saturated vapor pressure of nitrogen; R2 = coefficient of determination.
Taking the log of both sides of equation 2 and plotting the points of ( ,
, ) in the logarithmic coordinate system with
  denoting the abscissa and
  denoting the ordinate, L is the slope of the double logarithmic fitting line. The relationship between L and the fractal dimension D is expressed as

The pore-size distributions of five coal samples were tested by nitrogen adsorption at a temperature of 77 K (∼ −196°C or −321°F), and sample numbers are NQ-1–NQ-5, respectively. The  −
−  results of all the samples are shown in Figures 14–18 in which the pore diameter versus
  for green lines denote the corresponding pore diameter results. The
  −
−  data obtained by nitrogen adsorption tests have two stages (i.e., an evident inflection point exists in each testing result for the five coal samples). All the coefficients of determination of the linear fitting results before and after the inflection point exceed 0.88, and this indicates good fitting results.
 Figure 17. Nitrogen adsorption test results of sample NQ-4. P = adsorption pressure; P0 = saturated vapor pressure of nitrogen; R2 = coefficient of determination.
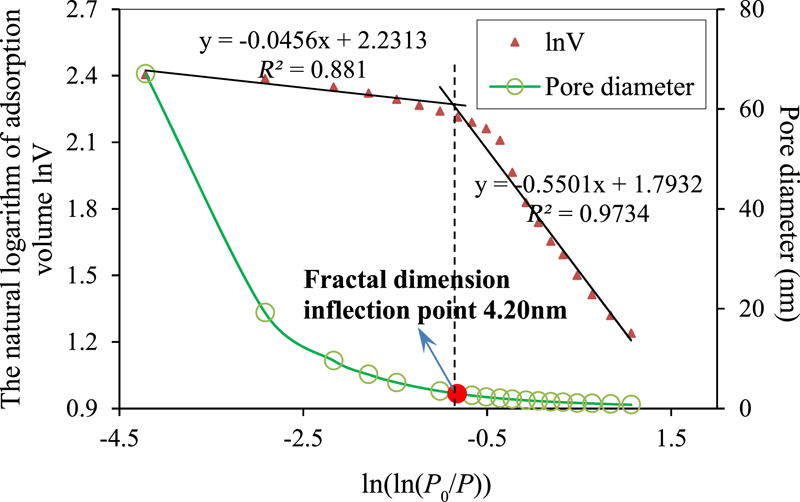 Figure 18. Nitrogen adsorption test results of sample NQ-5. P = adsorption pressure; P0 = saturated vapor pressure of nitrogen; R2 = coefficient of determination.
The fractal dimensions on both sides of the inflection point are calculated based on equation 3, and the results of all the samples are listed in Table 2.
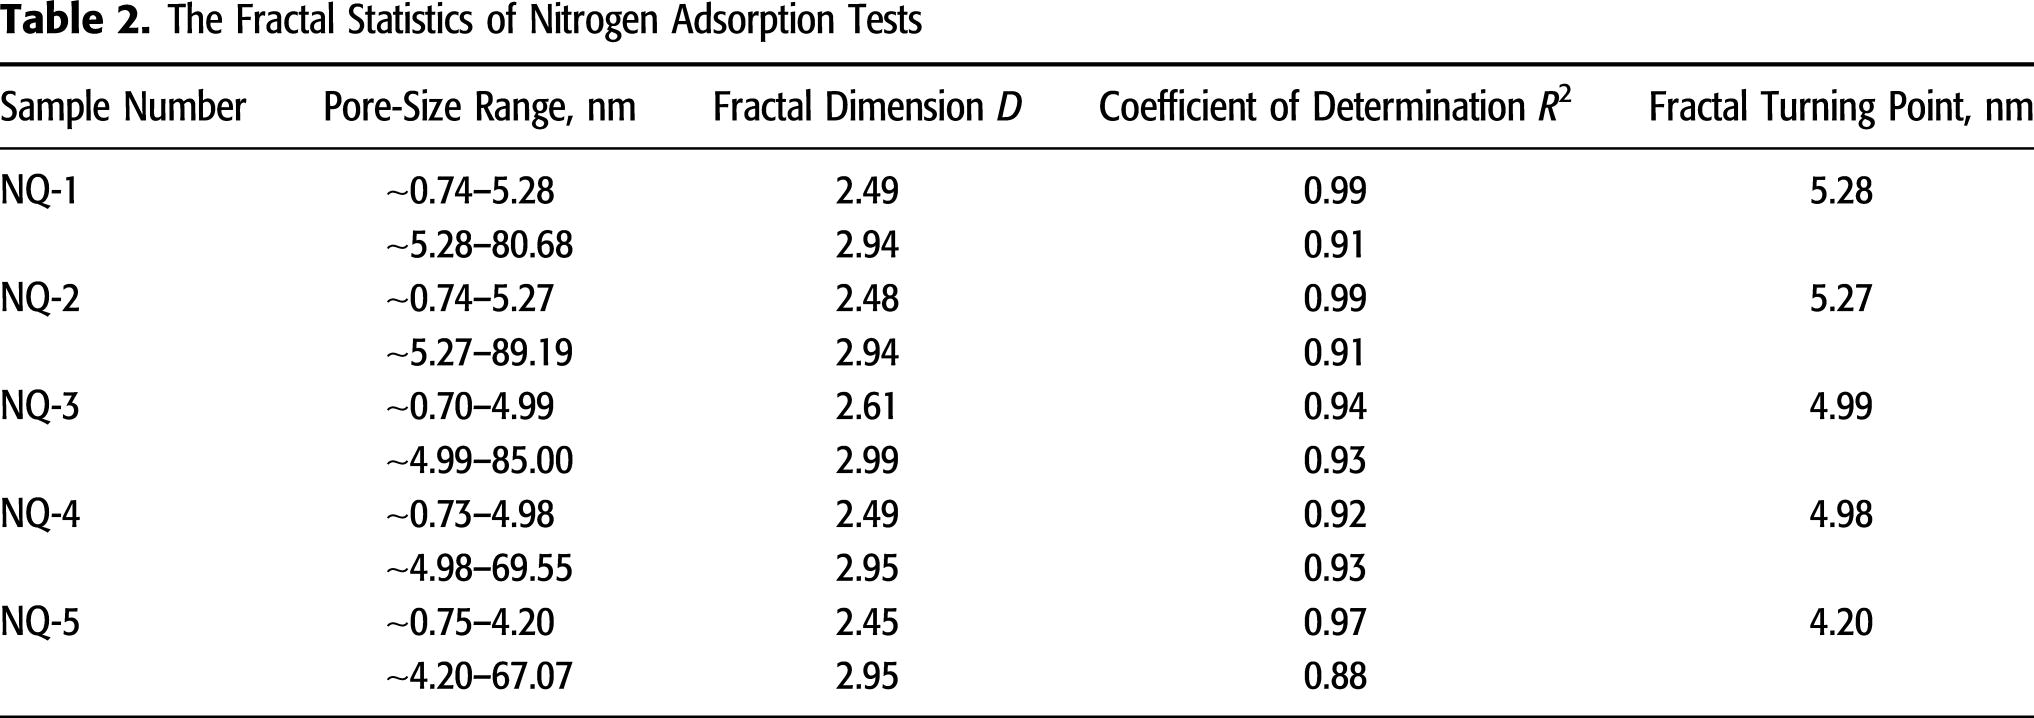
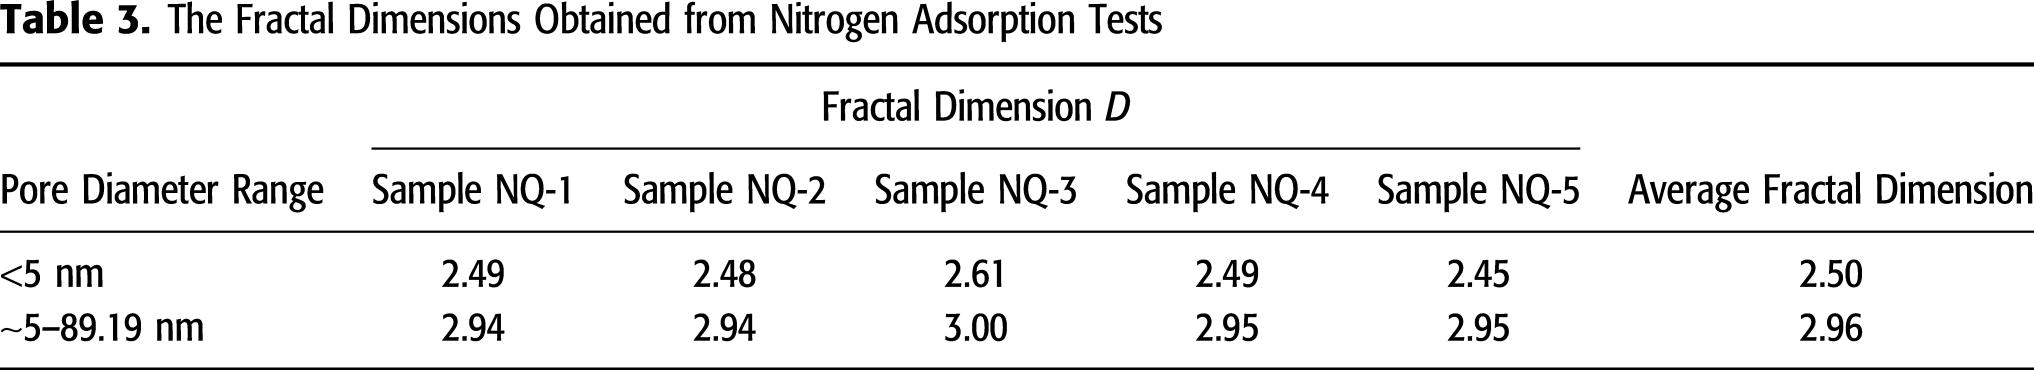
It is expedient to classify pores based on their size. A widely accepted classification method is as follows (Sing, 1985; Kondo et al., 1991): (1) micropores: pores with widths not exceeding approximately 2 nm; (2) mesopores: pores with widths between 2 and 50 nm; and (3) macropores: pores with widths exceeding approximately 50 nm. As shown in Table 2, the pore sizes tested by nitrogen adsorption are in the range of 0.70–89.19 nm and include micropores, mesopores, and a small number of macropores. All the fractal inflection points of samples are near 5 nm, and the average value is 4.94 nm. To facilitate statistics, the fractal inflection point is considered as approximately 5 nm. The fractal dimensions when the pore diameter is greater and lower than 5 nm are listed in Table 3. The fractal dimensions of microscopic pores whose sizes are less than 5 nm are close to 2.5 with an average value of 2.504. With respect to pores with sizes exceeding 5 nm, the fractal dimensions tested with different samples are also significantly closer, and the average value is 2.956.
Several important physical properties of coal are indirectly reflected by the fractal dimension. It characterizes the complexity and nonuniformity of the microscopic pore structure and the roughness and irregularity of the pore surface. The space filling capacity and methane adsorption capacity of coal are also reflected (Pfeifer and Avnir, 1983; Cai et al., 2013). Our fractal dimension calculation results indicate that the fractal dimension of the pores with sizes exceeding 5 nm is greater than that of pores with sizes less than 5 nm. It is demonstrated that the pores with sizes exceeding 5 nm are more complicated and inhomogeneous, and pore surfaces are more irregular and rougher. Therefore, they exhibit stronger methane adsorption capacity.
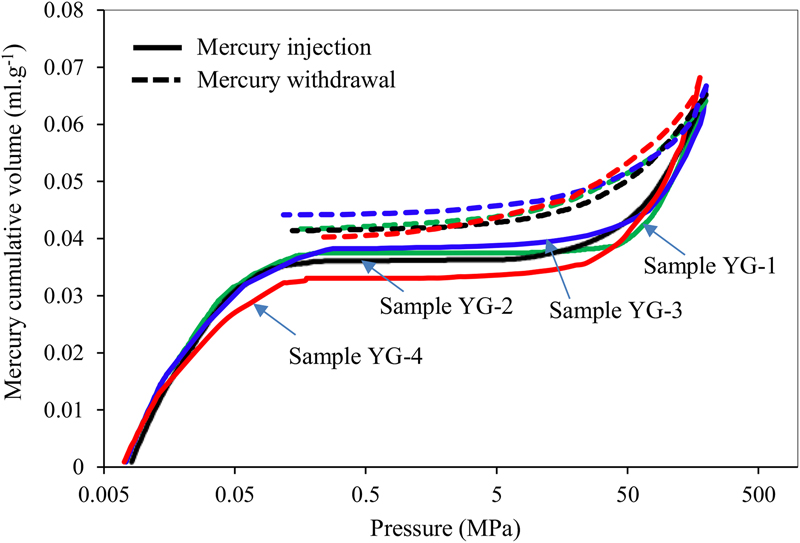 Figure 19. Mercury intrusion test results (1.0 MPa ≈ 145.04 psi).
Mercury Intrusion Test Results and Fractal Characterization
The mercury intrusion test results are shown in Figure 19. The unit of mercury cumulative volume is  (1.0 ml = 0.0002642 gal). The intrusion mercury curve and the withdrawal mercury curve do not coincide, and a hysteresis loop exists. Approximately 20% residual mercury is present in the coal sample when the withdrawn mercury pressure returns back to atmospheric pressure. The existence of a hysteresis loop has had different interpretations (Porcheron et al., 2004; Kaufmann et al., 2009). In the authors’ opinion, the generation of a hysteresis loop is related to the connectivity of pores. When the mercury is withdrawn, given the low compression of mercury, the mercury in mercury-filled shrinkage pores (ink bottle-shaped pores) is not easily released because of the reduced pressure. Intrusion–withdrawal mercury curves demonstrate that several shrinkage pores exist in the coal.
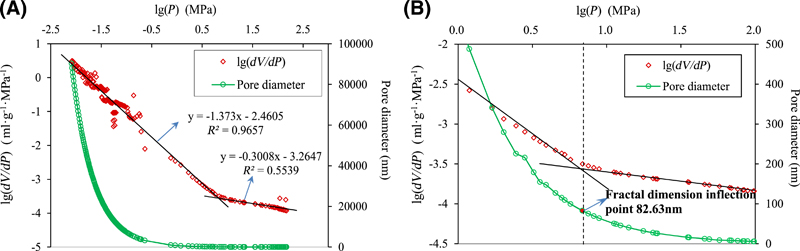 Figure 20. Mercury intrusion test results of sample YG-1: (A) overall range of pore size; (B) local range of pore size near the fractal inflection point (1.0 MPa ≈ 145.04 psi). dV/dP = change rate of the intrusion volume with respect to pressure; P = intrusion pressure; R2 = coefficient of determination.
The fractal dimension calculation using the results of a mercury injection test can be described based on the Menger sponge fractal model (Hegedus and Pereira, 1990; Jarz̧bski et al., 1995) and the Washburn equation (Washburn, 1921). During the process of the mercury intrusion test, the mercury could only be injected into microfractures or cleats between coal matrix blocks when the intrusion pressure is lower. The mercury enters the pores in the coal matrix only when the intrusion pressure is sufficiently elevated. The intrusion pressure applied when the mercury is injected into pores of a certain pore size is P, and corresponding pore volume is V. Plotting ( ,
, ) in the logarithmic coordinate system with
  as the abscissa and
  as the ordinate, K is the slope of the double logarithmic fitting line. The relationship between K and the fractal dimension D is expressed as

The fractal dimension of the coal microscopic pore structure that was tested by the mercury intrusion test can be calculated with equation 4.
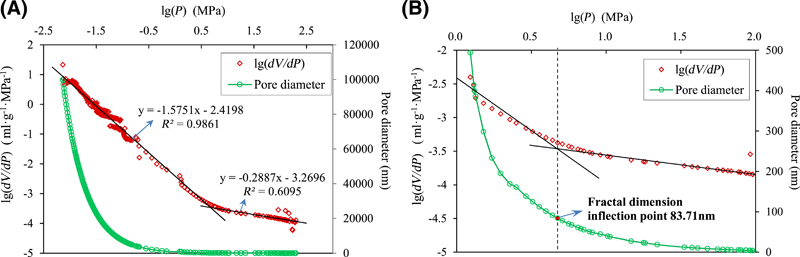 Figure 21. Mercury intrusion test results of sample YG-2: (A) overall range of pore size; (B) local range of pore size near the fractal inflection point (1.0 MPa ≈ 145.04 psi). dV/dP = change rate of the intrusion volume with respect to pressure; P = intrusion pressure; R2 = coefficient of determination.
The pore-size distributions of four coal samples were tested with sample numbers YG-1-YG-4. Results are shown in Figures 20–23, respectively. The green line denotes the relationship between the pore diameter and the logarithm of intrusion pressure, and an inflection point exists when the intrusion pressure is approximately 0.03–0.08 MPa (∼4.35–11.60 psi). This implies that the difficulty of mercury intrusion significantly increased when the pressure exceeded 0.03–0.08 MPa (4.35–11.60 psi) (corresponding pore-size range is 7–20 μm). In a manner similar to the nitrogen adsorption experimental results, the mercury intrusion tests also exhibit two stages (i.e., an inflection point exists in each testing result for the four coal samples).
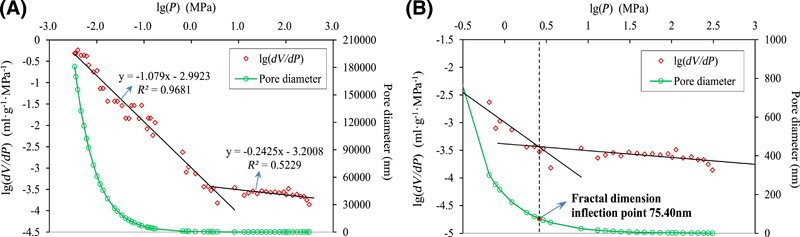 Figure 22. Mercury intrusion test results of sample YG-3: (A) overall range of pore size; (B) local range of pore size near the fractal inflection point (1.0 MPa ≈ 145.04 psi). dV/dP = change rate of the intrusion volume with respect to pressure; P = intrusion pressure; R2 = coefficient of determination.
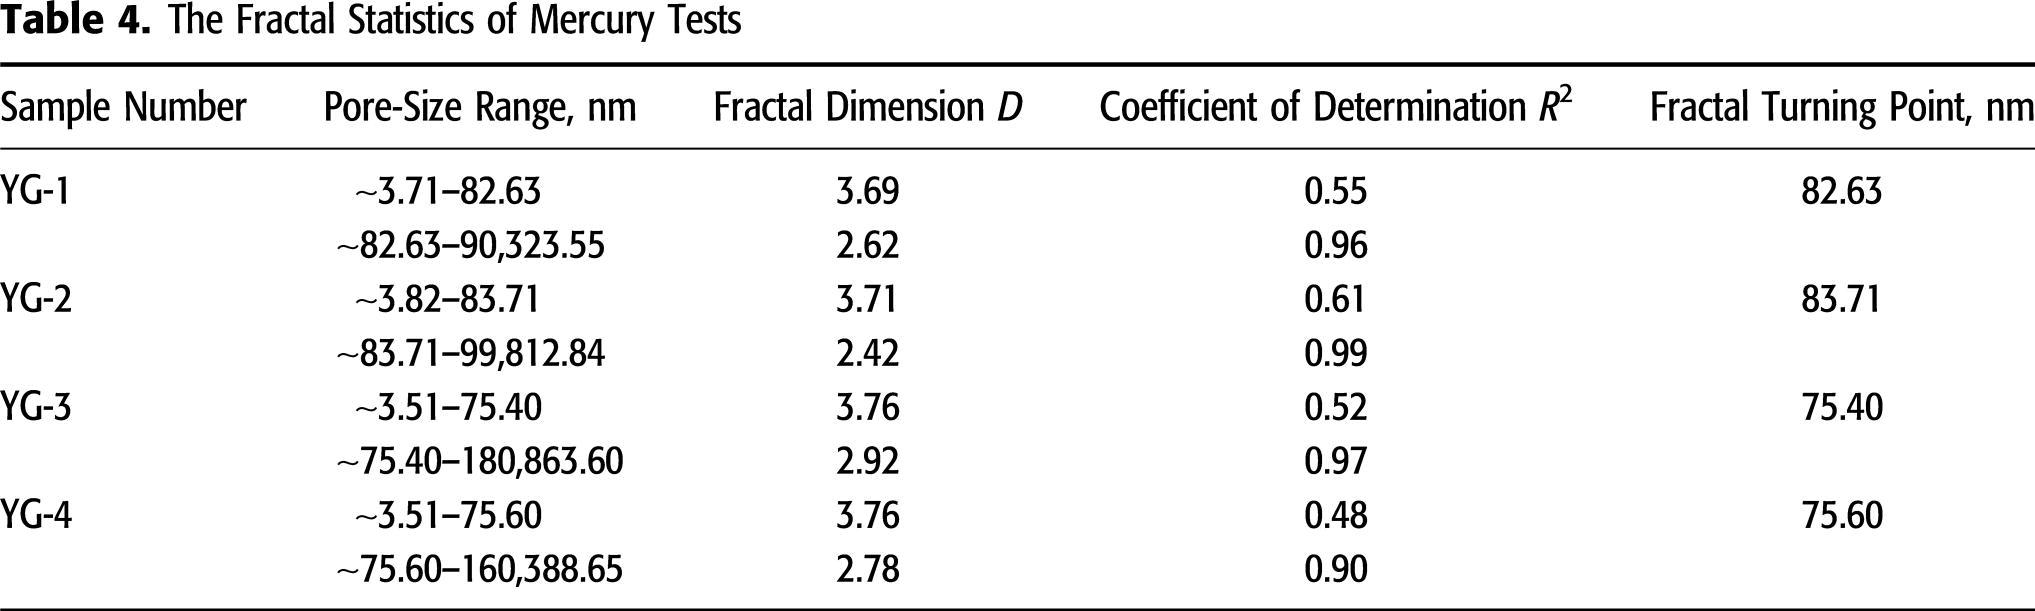
The fractal dimensions on both sides of the inflection point are calculated based on equation 4, and the results of all the samples are listed in Table 4. Fractal inflection points of all the samples are near 80 nm with an average value of 79.34 nm. To facilitate statistics, the fractal inflection point in this example is considered as approximately 80 nm. As shown in Figures 20–23, the intrusion data with pore sizes exceeding 80 nm corresponds to a good fit result, and all the coefficients of determination exceed 0.9. However, the fit results of the testing data where the pore size is less than 80 nm are questionable, and coefficients of determination are within the range of 0.48–0.61.
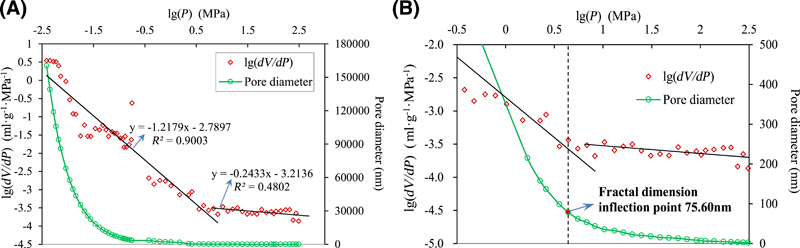 Figure 23. Mercury intrusion test results of sample YG-4: (A) overall range of pore size; (B) local range of pore size near the fractal inflection point (1.0 MPa ≈ 145.04 psi). dV/dP = change rate of the intrusion volume with respect to pressure; P = intrusion pressure; R2 = coefficient of determination.
The lower fitting coefficient of determination of the testing data when the pore size is less than 80 nm is related to the intrusion pressure. Previous studies (Li et al., 1999; Comisky et al., 2011) indicated that coal compressibility significantly affects mercury porosimetry results. Cleat compressibility is a measure of the cleat volume change ratio and is sensitive to external pressure changes (McKee et al., 1988; Seidle et al., 1992; Palmer, 2010; Zhou et al., 2011). Coal internal structure would be compressed or crushed under a higher intrusion pressure during the mercury intrusion process, and the pore-size testing data of the results become inaccurate (Li et al., 1999; Comisky et al., 2011). Specifically, low-rank coal is generally characterized by larger porosity, and serious damage would occur in the microscopic pore structure when the injection pressure is elevated.
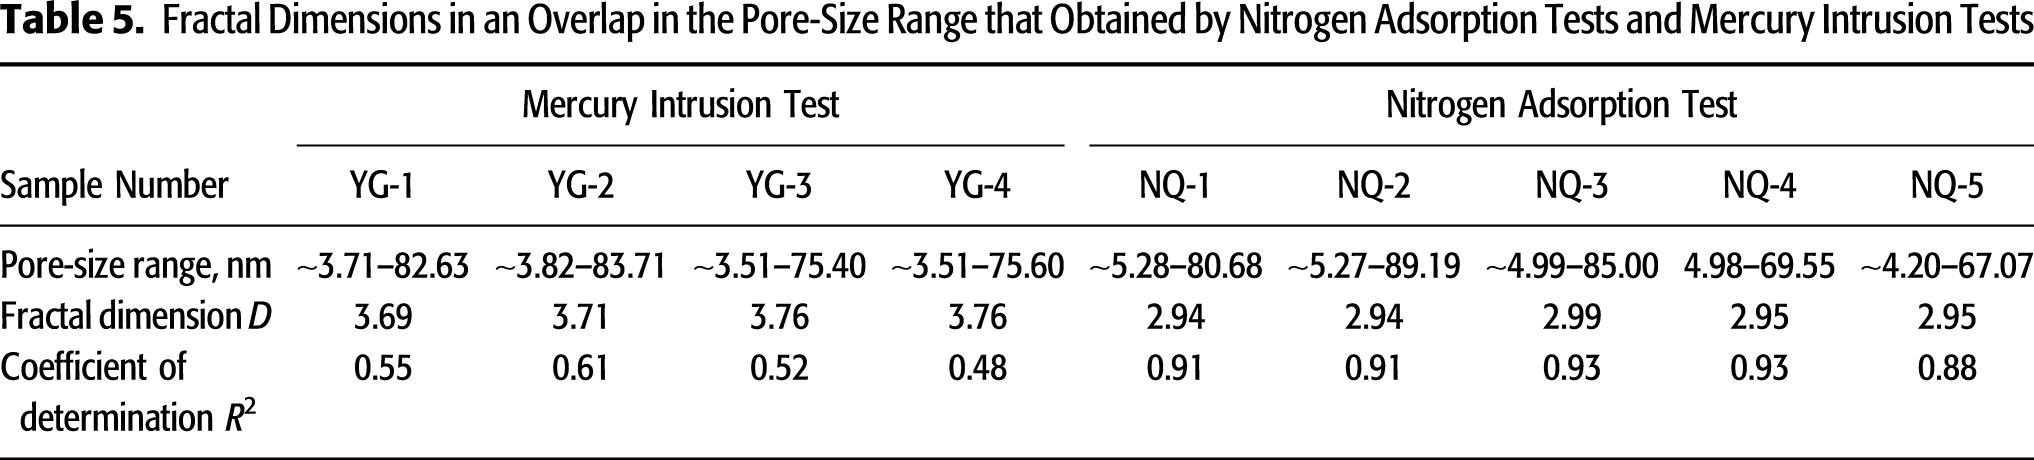
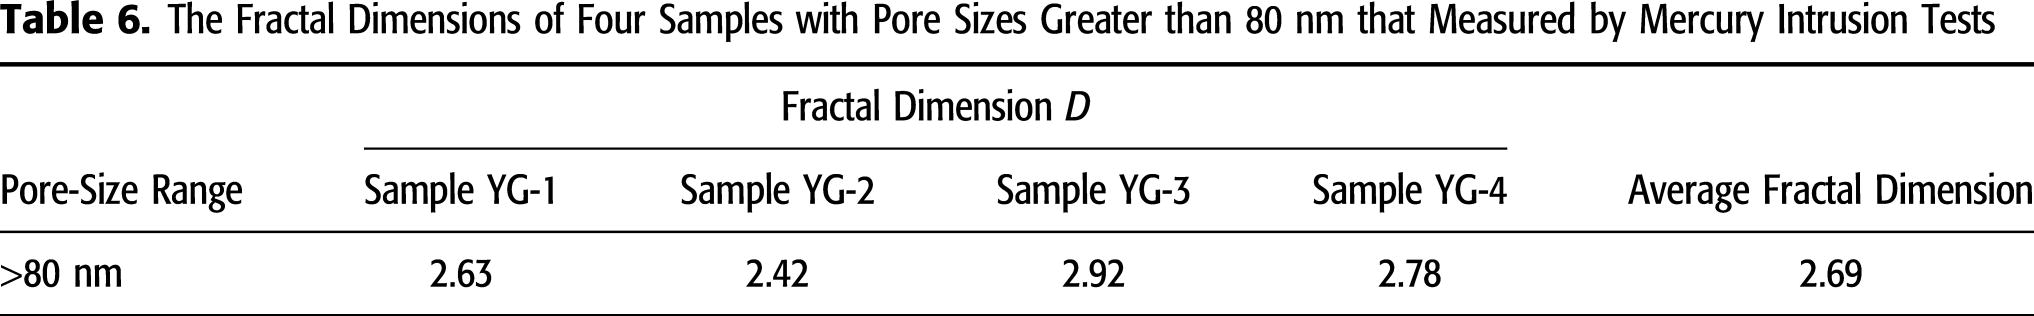
An overlap testing range occurs between both the aforementioned testing methods for pore-size distributions. The fractal dimension results in an overlap in the pore-size range (3.51–83.71 nm). These value are listed in Table 5. The pore-size distribution within the overlap range that was tested by the mercury intrusion test is not sufficiently accurate and results in the lower fitting coefficients of determination, as discussed above. As shown in Table 5, all the fitting coefficients of determination within the overlap pore-size range tested by nitrogen adsorption are larger than 0.88. The fractal dimensions of each sample for pore sizes exceeding 80 nm as measured by mercury intrusion tests are listed in Table 6.
In summary, the pore-size distribution and fractal characteristics of the microscopic pore structure of coal are systematically investigated by means of nitrogen adsorption and mercury intrusion tests. The fractal dimension of the microscopic pore structure exhibits two inflection points corresponding to approximately 5 and 80 nm. The fractal dimension of each pore-size range is shown in Figure 24. A three-level fractal characteristic of the microscopic pore structure is observed for low-rank coal that are obtained from the Hunchun coalfield, China. The fractal dimension of the pores within the range of 5–80 nm is highest, and the pores lower than 5 nm exhibit the lowest fractal dimension. Based on fractal theory, the fractal dimension characterizes the nonuniformity of the microscopic pore structure, the roughness and irregularity of the pore surface, the space filling capacity, and the methane adsorption capacity of coal (Pfeifer and Avnir, 1983; Krohn and Thompson, 1986; Cai et al., 2013; Liu and Nie, 2016). The fractal dimension results indicate that when compared with other pores that are less than 5 nm or greater than 80 nm, the pores within the range of 5–80 nm are the most complicated and inhomogeneous. Additionally, the pore surfaces are the most irregular and rough; thus, they exhibit higher methane adsorption capacity. Conversely, pores with sizes less than 5 nm show the best homogeneity and surface smoothness and exhibit the poorest methane adsorption capacity.
 Figure 24. The fractal dimensions of the overall pore-size range.
Coal is a typical dual porosity medium. The macrostructure of coal is extremely complex and changes greatly with coal rank. The results in this paper contribute to a better understanding of the pore structure and adsorption characteristics of coal. The research method provides a reference for the study of the fractal characteristics of other ranks of coal.
CONCLUSIONS
1. The microfractures distributed on surfaces that are perpendicular to coal bedding are rougher and more irregular than those parallel to bedding planes, and the former exhibit stronger space filling and methane adsorption capacity.
2. Adsorption–desorption curves present a hysteresis loop when the relative pressure is higher (P/P0 > 0.5), thereby indicating capillary condensation. A hysteresis loop also exists in the intrusion–withdrawal mercury curve, and approximately 20% residual mercury exists in the coal sample when the withdrawn mercury pressure returns to atmospheric pressure. Test results demonstrate that several shrinkage pores (ink-bottle–shaped pores) exist in our coal.
3. The nitrogen adsorption test exhibits high accuracy in the determination of the smaller pore distribution. When compared with the mercury intrusion test, the nitrogen adsorption test is more accurate for pore-size distribution and fractal characteristics investigation when pore sizes are less than 80 nm.
4. A three-level fractal characteristic of microscopic pore structure is observed for low-rank coals obtained from the Hunchun coalfield, China. The fractal dimension results indicate that when compared with the other pores that are less than 5 nm or exceed 80 nm, the pores within the range of 5–80 nm are the most complicated and inhomogeneous, and the pore surfaces are the most irregular and rougher. Thus, they exhibit stronger methane adsorption capacity. Conversely, the pores with sizes less than 5 nm exhibit optimal homogeneity and surface smoothness and the poorest methane adsorption capacity.
REFERENCES CITED
Abutaleb, A. S., 1989, Automatic thresholding of gray-level pictures using two-dimensional entropy: Computer Vision Graphics and Image Processing, v. 47, no. 1, p. 22–32, doi:10.1016/0734-189X(89)90051-0.
Ai, T., R. Zhang, H. W. Zhou, and J. L. Pei, 2014, Box-counting methods to directly estimate the fractal dimension of a rock surface: Applied Surface Science, v. 314 no. 10, p. 610–621, doi:10.1016/j.apsusc.2014.06.152.
Amarasekera, G., M. J. Scarlett, and D. E. Mainwaring, 1995, Micropore size distributions and specific interactions in coals: Fuel, v. 74, no. 1, p. 115–118, doi:10.1016/0016-2361(94)P4341-X.
Azemin, M. Z. C., F. A. Hamid, J. J. Wang, R. Kawasaki, and D. K. Kumar, 2015, Box-counting fractal dimension algorithm variations on retina images: Advanced Computer and Communication Engineering Technology, v. 362, p. 337–343, doi:10.1007/978-3-319-24584-3_27.
Bhandari, A. K., A. Kumar, and G. K. Singh, 2015, Tsallis entropy based multilevel thresholding for colored satellite image segmentation using evolutionary algorithms: Expert Systems with Applications, v. 42, no. 22, p. 8707–8730, doi:10.1016/j.eswa.2015.07.025.
Brink, A. D., 1992, Thresholding of digital images using two-dimensional entropies: Pattern Recognition, v. 25, no. 8, p. 803–808, doi:10.1016/0031-3203(92)90034-G.
Brunauer, S., L. S. Deming, W. E. Deming, and E. Teller, 1940, On a theory of the van der Waals adsorption of gases: Journal of the American Chemical Society, v. 62, no. 7, p. 1723–1732, doi:10.1021/ja01864a025.
Cai, Y. D., D. M. Liu, Z. J. Pan, Y. B. Yao, J. Q. Li, and Y. K. Qiu, 2013, Pore structure and its impact on CH4 adsorption capacity and flow capability of bituminous and subbituminous coals from Northeast China: Fuel, v. 103, p. 258–268, doi:10.1016/j.fuel.2012.06.055.
Cai, Y. D., D. M. Liu, Y. B. Yao, J. Q. Li, and J. L. Liu, 2011, Fractal characteristics of coal pores based on classic geometry and thermodynamics models: Acta Geologica Sinica, v. 85, no. 5, p. 1150–1162, doi:10.1111/j.1755-6724.2011.00547.x.
Cardott, B. J., and M. E. Curtis, 2018, Identification and nanoporosity of macerals in coal by scanning electron microscopy: International Journal of Coal Geology, v. 190, p. 205–217, doi:10.1016/j.coal.2017.07.003.
Cerofolini, G. F., and L. Meda, 1998, A theory of multilayer adsorption on rough surfaces in terms of clustering and melting BET piles: Surface Science, v. 416, no. 3, p. 403–422, doi:10.1016/S0039-6028(98)00594-9.
Chen, S., F. Zhang, C. J. Yan, and Y. Z. Liu, 2009, Analysis of rock CT images based on VC++ digital image processing technology: Mining Research & Development, v. 5, p. 63–65, doi:10.13827/j.cnki.kyyk.2009.05.027.
Clarkson, C. R., and R. M. Bustin, 1999, The effect of pore structure and gas pressure upon the transport properties of coals: A laboratory and modeling study. 1. Isotherms and pore volume distributions: Fuel, v. 78, no. 11, p. 1333–1344, doi:10.1016/S0016-2361(99)00055-1.
Comisky, J. T., M. Santiago, B. McCollom, and A. Buddhala, 2011, Sample size effects on the application of mercury injection capillary pressure for determining the storage capacity of tight gas and oil shales: Canadian Unconventional Resources Conference, Calgary, Alberta, Canada, November 15–17, 2011, 23 p., doi:10.2118/149432-MS.
Di, X. B., Z. P. Xi, and H. P. Tang, 2007, Analysis of pore-structure by fractal in sintered porous stainless steel fibres: Rare Metal Materials and Engineering, v. 36, no. 5, p. 571–573.
Faiz, M. M., N. I. Aziz, A. C. Hutton, and B. G. Jones, 1992, Porosity and gas sorption capacity of some eastern Australian coals in relation to coal rank and composition: Coalbed Methane Symposium, Townsville, Australia, November 19–21, 1992, p. 9-20.
Friesen, W. L., and R. J. Mikule, 1987, Fractal dimensions of coal particles: Journal of Colloid and Interface Science, v. 120, no. 1, p. 263–271, doi:10.1016/0021-9797(87)90348-1.
Friesen, W. I., and O. I. Ogunsola, 1995, Mercury porosimetry of upgraded western Canadian coals: Fuel, v. 74, no. 4, p. 604–609, doi:10.1016/0016-2361(95)98365-L.
Fu, Q. G., H. J. Li, X. H. Shi, X. L. Liao, K. Z. Li, and M. Huang, 2006, Microstructure and anti-oxidation property of CrSi2-SiC coating for carbon/carbon composites: Applied Surface Science, v. 252, no. 10, p. 3475–3480, doi:10.1016/j.apsusc.2005.05.018.
Fu, Y. S., X. F. Liu, B. Q. Ge, and Z. H. Liu, 2017, Role of chemical structures in coalbed methane adsorption for anthracites and bituminous coals: Adsorption, v. 23, no. 5, p. 711–721, doi:10.1007/s10450-017-9888-z.
Gamson, P. D., B. B. Beamish, and D. P. Johnson, 1993, Coal microstructure and micropermeability and their effects on natural gas recovery: Fuel, v. 72, no. 1, p. 87–99, doi:10.1016/0016-2361(93)90381-B.
Gan, H., S. P. Nandi, and P. L. Walker, Jr., 1972, Nature of the pororisty in American coals: Fuel, v. 51, no. 4, p. 272–277, doi:10.1016/0016-2361(72)90003-8.
Giffin, S., R. Littke, J. Klaver, and J. L. Urai, 2013, Application of BIB-SEM technology to characterize macropore morphology in coal: International Journal of Coal Geology, v. 114, p. 85–95, doi:10.1016/j.coal.2013.02.009.
Hegedus, L. L., and C. J. Pereira, 1990, Reaction engineering for catalyst design: Chemical Engineering Science, v. 45, no. 8, p. 2027–2044, doi:10.1016/0009-2509(90)80075-P.
Jaroniec, M., 1983, Physical adsorption on heterogeneous solids: Thin Solid Films, v. 100, no. 4, p. 325–328, doi:10.1016/0040-6090(83)90156-6.
Jarz̧bski, A. B., J. Lorenc, Y. I. Aristov, and N. Lisitza, 1995, Porous texture characteristics of a homologous series of base-catalyzed silica aerogels: Journal of Non-Crystalline Solids, v. 190, no. 3, p. 198–205, doi:10.1016/0022-3093(95)00276-6.
Kapur, J. N., P. K. Sahoo, and A. K. C. Wong, 1980, A new method for gray-level picture thresholding using the entropy of the histogram: Computer Vision, Graphics, and Image Processing, v. 29, no. 3, p. 223–237, doi:10.1016/0734-189X(85)90125-2.
Karacan, C. O., and E. Okandan, 2001, Adsorption and gas transport in coal microstructure: Investigation and evaluation by quantitative x-ray CT imaging: Fuel, v. 80, no. 4, p. 509–520, doi:10.1016/S0016-2361(00)00112-5.
Kaufmann, J., R. Loser, and A. Leemann, 2009, Analysis of cement-bonded materials by multi-cycle mercury intrusion and nitrogen sorption: Journal of Colloid and Interface Science, v. 336, no. 2, p. 730–737, doi:10.1016/j.jcis.2009.05.029.
Khalili, N. R., M. Pan, and G. Sandı́, 2000, Determination of fractal dimensions of solid carbons from gas and liquid phase adsorption isotherms: Carbon, v. 38, no. 4, p. 573–588, doi:10.1016/S0008-6223(99)00143-8.
Kondo, S., T. Ishikawa, and I. Abe, 1991, Science of adsorption: Tokyo, Maruzen, 128 p.
Krohn, C. E., and A. H. Thompson, 1986, Fractal sandstone pores: Automated measurements using scanning-electron-microscope images: Physical Review B, v. 33, no. 9, p. 6366–6374, doi:10.1103/PhysRevB.33.6366.
Laxminarayana, C., and P. J. Crosdale, 1999, Role of coal type and rank on methane sorption characteristics of Bowen Basin, Australia coals: International Journal of Coal Geology, v. 40, no. 4, p. 309–325, doi:10.1016/S0166-5162(99)00005-1.
Li, Y. H., G. Q. Lu, and V. Rudolph, 1999, Compressibility and fractal dimension of fine coal particles in relation to pore structure characterisation using mercury porosimetry: Particle & Particle Systems Characterization, v. 16, no. 1, p. 25–31, doi:10.1002/(SICI)1521-4117(199905)16:1<25::AID-PPSC25>3.0.CO;2-T.
Liu, X., and X. He, 2017, Effect of pore characteristics on coalbed methane adsorption in middle-high rank coals: Adsorption, v. 23, no. 1, p. 3–12, doi:10.1007/s10450-016-9811-z.
Liu, X., and B. Nie, 2016, Fractal characteristics of coal samples utilizing image analysis and gas adsorption: Fuel, v. 182, p. 314–322, doi:10.1016/j.fuel.2016.05.110.
Liu, Y., J. L. Lin, and K. Chen, 2015, A stable algorithm of box fractal dimension and its application in pore structure: Rare Metal Materials and Engineering, v. 44, no. 4, p. 800–804, doi:10.1016/S1875-5372(15)30050-3.
Mahamud, M. M., and V. García, 2018, Textural characterization of chars using fractal analysis of N2 and CO2, adsorption: Fuel Processing Technology, v. 169, p. 269–279, doi:10.1016/j.fuproc.2017.10.013.
Mahamud, M., Ó. López, J. J. Pis, and A. P. Jesús, 2003, Textural characterization of coals using fractal analysis: Fuel Processing Technology, v. 81, no. 2, p. 127–142, doi:10.1016/S0378-3820(03)00004-3.
Mahnke, M., and H. J. Mögel, 2003, Fractal analysis of physical adsorption on material surfaces: Colloid Surf A, v. 216, no. 1–3, p. 215–228, doi:10.1016/S0927-7757(02)00577-0.
Mandelbrot, B. B., 1982, The fractal geometry of nature: Stuttgart, Germany, W. H. Freeman and Company, 468 p.
Mastalerz, M., A. Drobniak, D. Strąpoć, W. S. Acosta, and J. Rupp, 2008, Variations in pore characteristics in high volatile bituminous coals: Implications for coal bed gas content: International Journal of Coal Geology, v. 76, no. 3, p. 205–216, doi:10.1016/j.coal.2008.07.006.
McKee, C. R., A. C. Bumb, and R. A. Koenig, 1988, Stress-dependent permeability and porosity of coal and other geologic formations: SPE Formation Evaluation, v. 3, no. 1, p. 81–91, doi:10.2118/12858-PA.
Messier, P. M., 1974, Scanning electron microscopy: Lunión Médicale Du Canada, v. 103, no. 4, p. 727–731.
Mosher, K., J. He, Y. Liu, E. Rupp, and J. Wilcox, 2013, Molecular simulation of methane adsorption in micro- and mesoporous carbons with applications to coal and gas shale systems: International Journal of Coal Geology, v. 109–110, p. 36–44, doi:10.1016/j.coal.2013.01.001.
Mostaghimi, P., R. T. Armstrong, A. Gerami, M. E. Warkaini, H. L. Ramandi, and V. Pinczewski, 2015, Micro-CT imaging and microfluidics for understanding flow in coal seam reservoirs: International Symposium of the Society of Core Analysts, Newfoundland, Canada, August 16–21, 2015, p. 16–21.
Nabelek, T., J. Keller, A. Galusha, and A. Zare, 2018, Fractal analysis of seafloor textures for target detection in synthetic aperture sonar imagery: International Society for Optics and Photonics, v. 10628, 1062810, doi:10.1117/12.2305023.
Nayak, S. R., J. Mishra, and P. M. Jena, 2018, Fractal dimension of grayscale images, in P. K. Pattnaik, S. S. Rautaray, H. Das, and J. Nayak, eds., Progress in computing, analytics and networking: Singapore, Springer, v. 710, p. 225–234, doi:10.1007/978-981-10-7871-2_22.
Neupane, B., Y. Ju, and C. Huang, 2017, Micro/nano-pore structure characterization of western and central Nepal coals using scanning electron microscopy and gas adsorption: Journal of Nanoscience and Nanotechnology, v. 17, no. 9, p. 6836–6842, doi:10.1166/jnn.2017.14401.
Nie, B. S., X. F. Liu, L. L. Yang, J. Q. Meng, and X. C. Li, 2015, Pore structure characterization of different rank coals using gas adsorption and scanning electron microscopy: Fuel, v. 158, p. 908–917, doi:10.1016/j.fuel.2015.06.050.
Nie, B. S., X. F. Liu, S. F. Yuan, B. Q. Ge, W. J. Jia, C. L. Wang, and X. H. Chen, 2016, Sorption charateristics of methane among various rank coals: Impact of moisture: Adsorption, v. 22, no. 3, p. 315–325, doi:10.1007/s10450-016-9778-9.
Palmer, I., 2010, Coalbed methane completions: A world view: International Journal of Coal Geology, v. 82, no. 3–4, p. 184–195, doi:10.1016/j.coal.2009.12.010.
Pfeifer, P., and D. Avnir, 1983, Chemistry in noninteger dimensions between two and three. I. Fractal theory of heterogeneous surfaces: Journal of Chemical Physics, v. 79, no. 7, p. 3558–3565, doi:10.1063/1.446210.
Porcheron, F., P. A. Monson, and M. Thommes, 2004, Modeling mercury porosimetry using statistical mechanics: Langmuir, v. 20, no. 15, p. 6482–6489, doi:10.1021/la049939e.
Poulton, M. M., N. Mojtabai, and I. W. Farmer, 1990, Scale invariant behaviour of massive and fragmented rock: International Journal of Rock Mechanics and Mining Sciences & Geomechanics Abstracts, v. 27, no. 3, p. 219–221, doi:10.1016/0148-9062(90)94331-M.
Qi, H., J. Ma, and P. Wong, 2002, Adsorption isotherms of fractal surfaces: Colloids and Surfaces A: Physicochemical and Engineering Aspects, v. 206, no. 1–3, p. 401–407, doi:10.1016/S0927-7757(02)00063-8.
Qi, L. L., X. Tang, Z. F. Wang, and X. S. Peng, 2017, Pore characterization of different types of coal from coal and gas outburst disaster sites using low temperature nitrogen adsorption approach: International Journal of Mining Science and Technology, v. 27, no. 2, p. 371–377, doi:10.1016/j.ijmst.2017.01.005.
Radlinski, A. P., M. Mastalerz, A. L. Hinde, M. Hainbuchner, H. Rauch, M. Baron, J. S. Lin, L. Fan, and P. Thiyagarajan, 2004, Application of SAXS and SANS in evaluation of porosity, pore size distribution and surface area of coal: International Journal of Coal Geology, v. 59, no. 3–4, p. 245–271, doi:10.1016/j.coal.2004.03.002.
Rahmat, S. B., S. Rodrigues, T. Blach, and J. Esterle, 2015, Inheritance of pore structure from wood to vitrain in different rank coals and their relationship with gas sorption capacity—A case study from New Zealand coal: 32nd Society for Organic Petrology Annual Meeting, Yogyakarta, Indonesia, September 20–27, 2015, v. 32, p. 112.
Ritter, H. L., and L. C. Drake, 1945, Pore size distribution in porous materials. Pressure porosimeter and determination of complete macropore size distributions: Industrial & Engineering Chemistry Research, v. 17, p. 782–791.
Schmitt, M., C. P. Fernandes, J. A. B. da Cunha Neto, F. G. Wolf, and V. S. S. dos Santos, 2013, Characterization of pore systems in seal rocks using nitrogen gas adsorption combined with mercury injection capillary pressure techniques: Marine and Petroleum Geology, v. 39, no. 1, p. 138–149, doi:10.1016/j.marpetgeo.2012.09.001.
Seidle, J. P., M. W. Jeansonne, and D. J. Erickson, 1992, Application of matchstick geometry to stress dependent permeability in coals: Society of Petroleum Engineers Rocky Mountain Regional Meeting, Casper, Wyoming, May 18–21, 1992, SPE-24361-MS, doi:10.2118/24361-MS.
Sing, K. S. W., 1985, Reporting physisorption data for gas/solid systems with special reference to the determination of surface area and porosity (Recommendations 1984): Pure and Applied Chemistry, v. 57, no. 4, p. 603–619, doi:10.1351/pac198557040603.
Sing, K. S. W., 2004, Characterization of porous materials: Past, present and future: Colloids and Surfaces A: Physicochemical and Engineering Aspects, v. 241, no. 1–3, p. 3–7, doi:10.1016/j.colsurfa.2004.04.003.
Smith, D. M., and F. L. Williams, 1984, Diffusional effects in the recovery of methane from coalbeds: Society of Petroleum Engineers Journal, v. 24, no. 5, p. 529–535, doi:10.2118/10821-PA.
Smith, D. M., and F. L. Williams, 1987, Adsorption and diffusion in western United States coals, in Coal science and chemistry: Amsterdam, Elsevier, p. 381–403.
Suuberg, E. M., S. C. Deevi, and Y. Yun, 1995, Elastic behaviour of coals studied by mercury porosimetry: Fuel, v. 74, no. 10, p. 1522–1530, doi:10.1016/0016-2361(95)00110-Q.
Tang, H. P., J. Z. Wang, J. L. Zhu, Q. B. Ao, J. Y. Wang, B. J. Yang, and Y. N. Li, 2012, Fractal dimension of pore-structure of porous metal materials made by stainless steel powder: Powder Technology, v. 217, p. 383–387, doi:10.1016/j.powtec.2011.10.053.
Thomas, J., and Damberger, H. H., 1976, Internal surface area, moisture content, and porosity of Illinois coals: Variations with coal rank: Illinois State Geological Survey, v. 493, 38 p.
Toda, Y., and S. Toyoda, 1972, Application of mercury porosimetry to coal: Fuel, v. 51, no. 3, p. 199–201, doi:10.1016/0016-2361(72)90080-4.
Tomita, A., K. Higashiyama, and Y. Tamai, 1981, Scanning electron microscopic study on the catalytic gasification of coal: Fuel, v. 60, no. 2, p. 103–114, doi:10.1016/0016-2361(81)90003-X.
Washburn, E. W., 1921, The dynamics of capillary flow: Physical Review, v. 17, no. 3, p. 273–283, doi:10.1103/PhysRev.17.273.
Wang, R., Z. Zhuo, H. W. Zhou, and J. F. Liu, 2017, A fractal derivative constitutive model for three stages in granite creep: Results in Physics, v. 7, p. 2632–2638, doi:10.1016/j.rinp.2017.07.051.
Xie, H. P., 1996, Fractal dimension and its calculation methods, in Fractals—An introduction to rock mechanics: Beijing, China, Science Press, p. 15–23.
Xu, W., Z. Yue, and R. Hu, 2008, Study on the mesostructure and mesomechanical characteristics of the soil–rock mixture using digital image processing based finite element method: International Journal of Rock Mechanics and Mining Sciences, v. 45, no. 5, p. 749–762, doi:10.1016/j.ijrmms.2007.09.003.
Yao, Y., and D. Liu, 2006, Pore system characteristics of coal reservoirs and their influence on recovering of coalbed methane in Henan coalfields: Coal Science and Technology, v. 34, p. 64–68.
Yao, Y. B., D. M. Liu, D. Z. Tang, S. H. Tang, and W. H. Huang, 2008, Fractal characterization of adsorption-pores of coals from North China: An investigation on CH4 adsorption capacity of coals: International Journal of Coal Geology, v. 73, no. 1, p. 27–42, doi:10.1016/j.coal.2007.07.003.
Zhang, H., Q. Zhu, and X. F. Guan, 2012, Probe into image segmentation based on Sobel operator and maximum entropy algorithm: International Conference on Computer Science and Service System, Nanjing, China, August 11–13, 2012, p. 238–241, doi:10.1109/CSSS.2012.67.
Zhao, Y. X., Y. F. Sun, S. M. Liu, K. Wang, and Y. D. Jiang, 2017, Pore structure characterization of coal by NMR cryoporometry: Fuel, v. 190, p. 359–369, doi:10.1016/j.fuel.2016.10.121.
Zhou, F., G. Yao, Z. Tang, and O. D. Orodu, 2011, Influence and sensitivity study of matrix shrinkage and swelling on enhanced coalbed methane production and CO2 sequestration with mixed gas injection: Energy Exploration & Exploitation, v. 29, no. 6, p. 759–775, doi:10.1260/0144-5987.29.6.759.
Zhou, H. W., J. C. Zhong, W. G. Ren, X. Y. Wang, and H. Y. Yi, 2018, Characterization of pore-fracture networks and their evolution at various measurement scales in coal samples using X-ray μCT and a fractal method: International Journal of Coal Geology, v. 189, p. 35–49, doi:10.1016/j.coal.2018.02.007.
Zhou, S. D., D. M. Liu, Y. D. Cai, Y. B. Yao, and Z. T. Li, 2017, 3D characterization and quantitative evaluation of pore-fracture networks of two Chinese coals using FIB-SEM tomography: International Journal of Coal Geology, v. 174, p. 41–54, doi:10.1016/j.coal.2017.03.008.
ACKNOWLEDGMENTS
We gratefully acknowledge the support of the China National Natural Science Foundation (no. 41731284) and the China Postdoctoral Science Foundation Grant (no. 2017M622551). Our deepest gratitude goes to the reviewers and editors of the AAPG Bulletin for their careful work and thoughtful suggestions that have helped improve this paper substantially.