ABSTRACT
Petroleum exploration is a risky business, and dry holes (wells that failed to find movable petroleum fluids) are common, especially in frontier and emerging basins and plays. Technically rigorous, systematic, and consistent postdrill analysis may convert dry holes from disasters to exploration wisdom and future success. Here, we present a decision tree to determine the key failure mode for individual segments in conventional petroleum prospects and illustrate its utility with examples from the deep-water Taranaki Basin, offshore New Zealand. We hope that this decision tree, or its customized versions, will become the best practice in postdrill analysis across the exploration industry.
INTRODUCTION
The first dry hole in the United States (the Grandin well) was drilled just 4 days after completion of the United States’ first commercial well (the Drake well) in Pennsylvania in 1859. The Grandin well was located approximately 15 mi (∼24 km) away from the Drake well and targeted the same play (Devonian sandstones) but did not find the oil-producing formation (American Oil and Gas Historical Society, 2018). This first dry hole showed the risks involved in petroleum exploration. About half of conventional petroleum exploration wells drilled around the world in 2008–2017 failed to find movable petroleum fluids (Milkov and Navidi, 2020). These dry holes cost the petroleum industry billions of United States dollars every year. Although the dry wells themselves are an economic loss to investors, every one of them serves as an exciting experiment in nature’s own laboratory (Pratt, 1942) and provides valuable information to petroleum geoscientists. The industry is compensated for its dry holes when explorers conduct thorough postdrill (postmortem) analysis and use the gathered information to revise subsurface models and justify either drilling new exploration wells or scrapping the exploration plan altogether.
Petroleum explorers generally do not like to dwell on well failures and often simply ignore dry holes (Longley, 2012). Some think that this is because explorers are optimists by nature (Rose, 2001). However, other factors may contribute to this situation. Individual explorers may find it difficult to accept failures because dry holes threaten their professionalism, self-esteem, and credibility. Companies may have cultures in which dry holes are stigmatized and exploration teams involved in them are punished. Only 60% of larger exploration companies with dedicated assurance teams (n = 37) systematically conduct postdrill reviews (Citron et al., 2017). Studies of well failures are essentially absent in peer-reviewed literature, whereas the descriptions of successful discoveries are plentiful (e.g., Halbouty, 1970, 1980, 1992, 2003; Merrill and Sternbach, 2017). However, by studying only the success stories, explorers tend to learn the wrong lessons. Similar to how progress in medical science occurred one funeral at a time (Ayres, 2007), progress in petroleum exploration occurs one dry hole at a time. To ensure that exploration drilling capital gets the highest return on investment, explorers have to review both successes and failures with equal passion and discipline. Explorers not conducting systematic postdrill analysis rob themselves of the opportunity to get valuable feedback on their predrill forecasts and decisions. Such explorers do not improve, and their years of experience do not transform to expertise.
Similar to other industries (Syed, 2015), several things are necessary in order to learn from failures. Individual explorers and managers need to accept that mistakes in exploration models (and, therefore, dry holes) are normal. The subsurface is extremely complex, and the occurrence of petroleum fluids is difficult to predict and describe (e.g., Milkov, 2017). Explorers do not fully understand the subsurface, especially in frontier plays (Rudolph and Goulding, 2017; Milkov and Navidi, 2020) and never will. Dry holes are inevitable consequences of the mismatch between the complexity of the subsurface and our ability to understand it. Therefore, dry holes are not embarrassing but educative, and learning from them is imperative. To facilitate this learning, companies must have a culture in which it is safe to drill dry holes, comprehensive information is collected from dry holes to make these failures data rich, and lessons from dry holes are widely shared and hardwired into the exploration process. With such a constructive attitude toward dry holes, companies could then design and implement meaningful reforms in the exploration process and set the stage for future exploration success.
During the postdrill analysis, geoscientists study drilling results and compare their predrill forecasts with the well outcomes. Segment is a subsurface feature that represents a potential petroleum pool (Milkov, 2015). Prospects are composed of one or more segments. Because wells may target several segments, the postmortem analysis should be conducted for each failed segment that was predicted to contain petroleum (including failed segments in discovery wells). A key objective of such analysis is to determine the failure mode for the segment (i.e., to determine if the segment does not contain movable petroleum because of a lack of reservoir, charge, seal, etc.). Because findings from exploration wells provide certain competitive advantages, very few postdrill analyses find their way into peer-reviewed literature. Aggregated results are available for the industry (Laver et al., 2012), individual companies (Rudolph and Goulding, 2017), specific exploration areas (Loizou, 2005; Tari and Simmons, 2018), and specific plays (Grant et al., 1996; Loizou et al., 2006; Longley and Brown, 2016), but these reports do not disclose the methodologies of well failure analysis. Mathieu (2015, 2018) presented a detailed analysis of 104 exploration segments (targets) penetrated by 98 wells drilled in the United Kingdom North Sea between 2003 and 2013, of which 94 segments did not contain movable petroleum fluids. He determined that 38% of the segments failed because of the lack of lateral, top, or bottom seals; 19% failed because of the lack of closure (trap or incorrectly picked horizon for the top of the reservoir); 23% failed because of the absence of reservoir facies; 12% failed because of the lack of petroleum migration; 5% failed because of the lack of reservoir deliverability (e.g., low permeability); and 3% failed because of the lack of mature source rock(s). However, Mathieu (2018) did not present a detailed methodology used to determine the failure modes in failed segments. He decided the failure mode based on the readily available data (e.g., “trap appeared robust,” “no recorded shows,” p. 267) and his expert judgement. Many exploration companies use a similar approach, but it may lead to incorrect conclusions as well as biased and inconsistent assessments between different exploration groups (Milkov, 2015). If failure modes of individual segments are identified incorrectly and/or inconsistently, the aggregated results (e.g., Citron et al., 2018) will be misleading, and the company may try to fix problems that do not exist while not addressing the real issues.
Here, we describe how to define success and failure when evaluating the presence of structure (closure), reservoir facies, reservoir deliverability, seals, mature source, and migration. We then present a decision tree to determine the key failure mode for conventional segments and demonstrate its utility with examples from the Anadarko 1 Romney well drilled in the deep-water Taranaki Basin offshore New Zealand. Consistent application of this decision tree and the implementation of reanalyzed and newly acquired information in future exploration programs will increase both the scientific and economic return on dry holes (Birkinshaw and Haas, 2016). We hope that our decision tree, or its customized versions, will become the best practice in postdrill analysis across the exploration industry.
DEFINING SUCCESS AND FAILURE
Technically robust and comprehensive yet simple definitions are the first necessary step in ensuring consistency of subsurface evaluations. We address only geological (technical) successes and failures in this study. We define geological success as the event in which a conventional exploration well finds petroleum fluids that freely and sustainably flow into the well from the penetrated subsurface segment(s), given the actions of a prudent operator (Rose, 2001; Milkov, 2015). A dry conventional exploration well fails to find movable petroleum fluids in all penetrated segments (and we call these segments “failed” or “dry”). A successful conventional well finds movable petroleum fluids in at least one segment, although it also may fail to find petroleum fluids in other dry segments.
The postdrill analysis of a segment’s failure mode must be related to the predrill evaluation of risk factors. Different exploration companies evaluate a varying number of risk factors (from 4 to 19, commonly 5–7) in their assessment of geological probability of success (PoS). Milkov (2015) defined six risk factors, which are multiplied to calculate the total geological PoS, and here we define success and failure for the presence of the same six factors: structure, reservoir facies, reservoir deliverability, seal, mature source rock, and migration (including timing). Below, we describe successes and failures for these elements and illustrate them in Figures 1–7. The illustrations are inspired by the work of Sykes et al. (2011). However, in sharp contrast to the ExxonMobil approach described by Sykes et al. (2011), we separate risks and volumes. According to our definition, the well is successful if it finds any freely and sustainably flowing petroleum fluids, irrespective of the volume. Our approach is common in many exploration companies but differs from the approach of ExxonMobil. There, geoscientists consider, for instance, the reservoir presence as a failure if the well does not find a minimum specified thickness sufficient to contain some predetermined minimum volumes of petroleum fluids (Sykes et al., 2011). In our approach, if the reservoir is present but is thinner or has lower net-to-gross ratio than predicted in the predrill model, it is the failure of the volumetric model and not of the risk model. Because all segments are unique, Figures 1–7 illustrate the general concepts of successes and failures; they are not an exhaustive catalog of possible geological situations.
 Figure 1. Definition of success and failure for the presence of structure (closure, container). The postdrill structure may be similar to the predrill structure (A, B) or may have different amplitude (C) or shape and location (D). Although the well is dry, the segment may contain no petroleum (A, C) or may contain petroleum (green shading with question mark) updip from the well (B, D), in which case the segment may be reevaluated and redrilled. The structure is absent if the new mapping using data from the drilled well definitively suggests so (E).
Predrill description of the structure (closure, geometry, container, which includes stratigraphic traps) includes the statement that the structure is present with a given PoS and the map of the structure (or, better, several maps). In this definition, we do not risk some minimum structure but risk the presence of a structure of any size, with the specific size described as uncertainty in the volumetric model. In the postdrill analysis, the first objective is to determine if the structure is indeed present (success) or if it is absent (failure). When the structure is present, the postdrill map may be similar to the predrill map (Figure 1A, B) or very different from it (Figure 1C, D). The petroleum accumulation may be definitively absent in the segment (Figure 1A, C). The accumulation may be present updip from a well designed to test the petroleum–water contact (Figure 1B) or in case the crest of the structure turned out to be located in a different location (Figure 1D). In those cases, the segment may be not dry (uncertain result), and it should be reevaluated. The structure is absent when the postdrill mapping using the well data (logs, well ties) and newly processed well-calibrated (e.g., with vertical seismic profiling) seismic volume determine that there is no structure (Figure 1E). Seismic mapping is uncertain, which is because of uncertainty in horizon picking, time–depth conversion, and gridding (Rankey and Mitchell, 2003; Chellingsworth et al., 2015). Therefore, a more rigorous definition of structure success or failure may involve a probabilistic analysis of structure presence. Another complication is that the structure may be complex and have, for example, fault-dependent and fault-independent parts (Norman, 2012). In our approach, we evaluate the part of the segment that the well tested, and it is possible that petroleum occurs somewhere else in the segment, even if the well was dry.
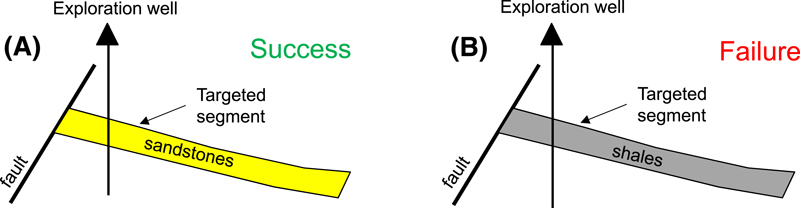 Figure 2. Examples of success (A) and failure (B) for the presence of reservoir facies.
In the predrill assessment, we risk the presence of any reservoir facies that may contain any amount of movable petroleum fluids (Milkov, 2015). Presence or absence of the reservoir facies can be established from well logs, cuttings, sidewall cores, and conventional cores (Figure 2). The presence of the reservoir facies can still be considered a success even if the discovered reservoir facies differ from the predrill predictions (e.g., carbonates as opposed to sandstones). However, previously used subsurface models would then need to be updated with the information gathered regarding the actual reservoir facies found.
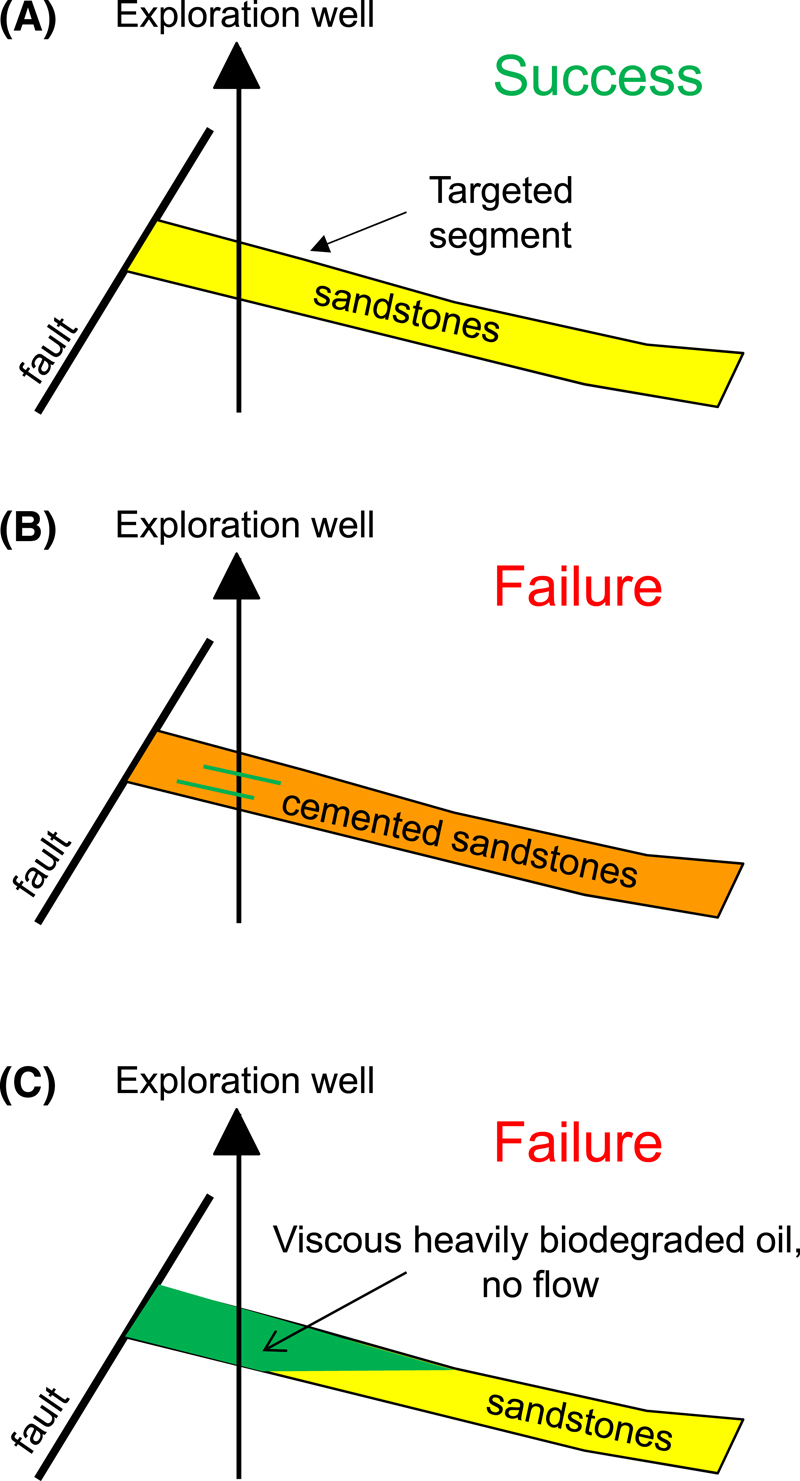 Figure 3. Examples of success (A) and failure (B, C) for reservoir deliverability. Green dashes in (B) demonstrate nonmovable petroleum fluids in cemented sandstones.
Figure 3 describes success and failure cases for reservoir deliverability. Success is when well logs and core data show that the segment contains reservoir facies with high enough porosity and permeability to flow the predicted or likely petroleum fluid phase (Figure 3A). The segment lacks reservoir deliverability if the reservoir has permeability too low to flow petroleum fluid (e.g., tight cemented sandstones, Figure 3B) or has fluids with high viscosity, which inhibits free sustainable flow of petroleum (e.g., heavily biodegraded oil, Figure 3C).
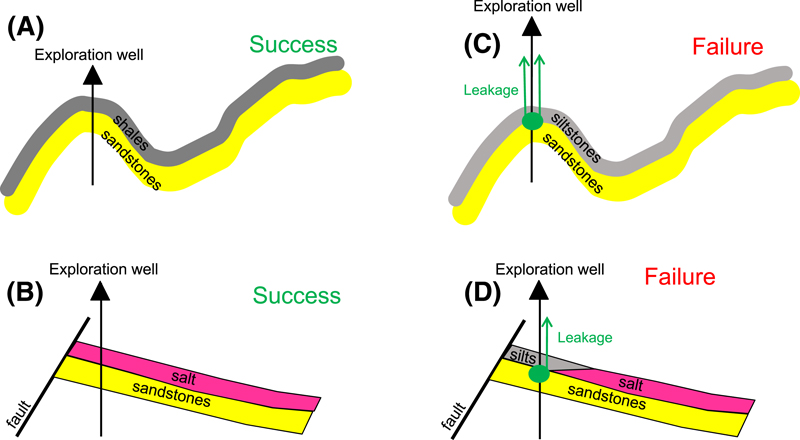 Figure 4. Examples of success (A, B) and failure (C, D) for top seal. Green dots in (C) and (D) indicate the presence of petroleum shows and oil or gas anomalies, suggesting that petroleum migrated through the segment.
When well logs and core data suggest that a good, effective top seal caps the reservoir in the drilled segment, success for the top seal can be declared (Figure 4). Most top seals leak (except for evaporites), so we need to understand the effectiveness of the seal or its sealing capacity, not just its presence. Even if the seal appears to be present based on the lithology and thickness, special measurements, such as capillary entry pressure, are often necessary to quantify the sealing capacity (effectiveness) of the seal. This is especially critical if the seal contains thermogenic petroleum (e.g., as inferred from IsoTube gas data) and is therefore apparently leaky. Still, in line with the common approach in this paper, we declare the success for top seal if it is capable of holding any column of petroleum, as opposed to only a column of a minimum predetermined size.
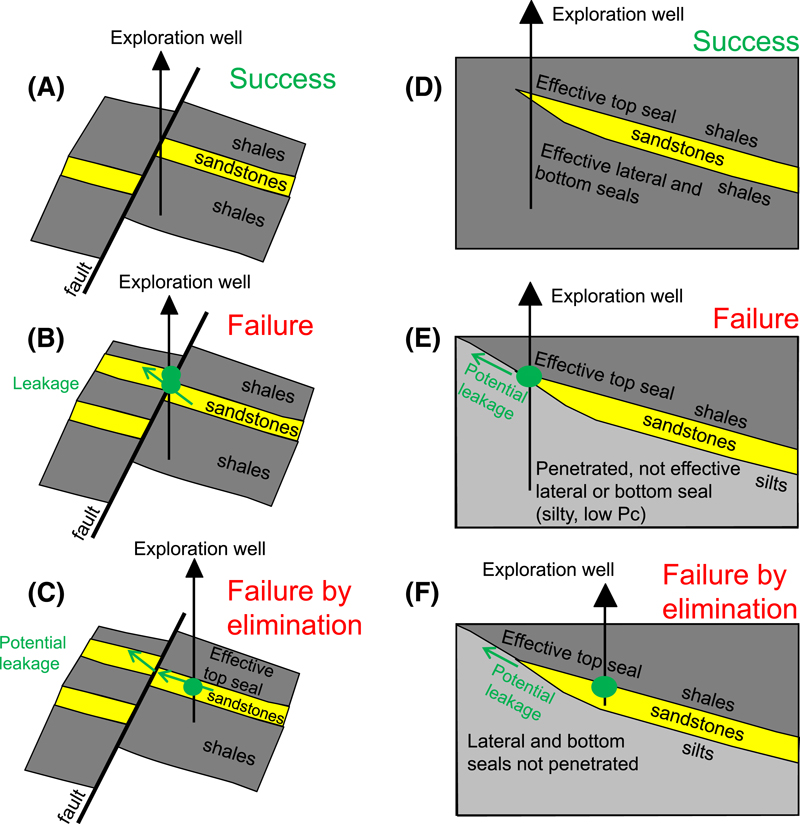 Figure 5. Examples of success (A, D) and failure (B, C, E, F) for lateral seal in the fault-bounded segment (A, B, C) and for lateral and bottom seals in a stratigraphic trap (D, E, F). Green dots in (B), (C), (E), and (F) indicate the presence of petroleum shows and gas anomalies, suggesting that petroleum migrated through the segment. Pc = capillary entry pressure.
Although declaring either success or failure on the top seal is relatively straightforward, lateral seals are rarely penetrated intentionally. If the lateral seal is penetrated and well logs and core data directly show that the reservoir in the targeted segment is juxtaposed against sealing lithology across the fault, then success can be established (Figure 5A). Failure can also be clearly established if the lateral seal is penetrated but the reservoir is juxtaposed against nonsealing lithology across the fault. Petroleum shows or thermogenic gases present on both sides of the fault would confirm that cross-fault migration has occurred and that the lateral seal is absent or ineffective (Figure 5B). However, it is far more likely that the exploration well has not directly tested the lateral seal. If the segment has an untested lateral seal yet has all of the other elements in place (structure, reservoir facies, reservoir deliverability, top seal, mature source migration) and still no movable petroleum fluids, then the lateral seal can be designated as the failure mode by the process of elimination. Similar principles apply to the postdrill evaluation of lateral and bottom seals in stratigraphic traps (Figure 5C–E).
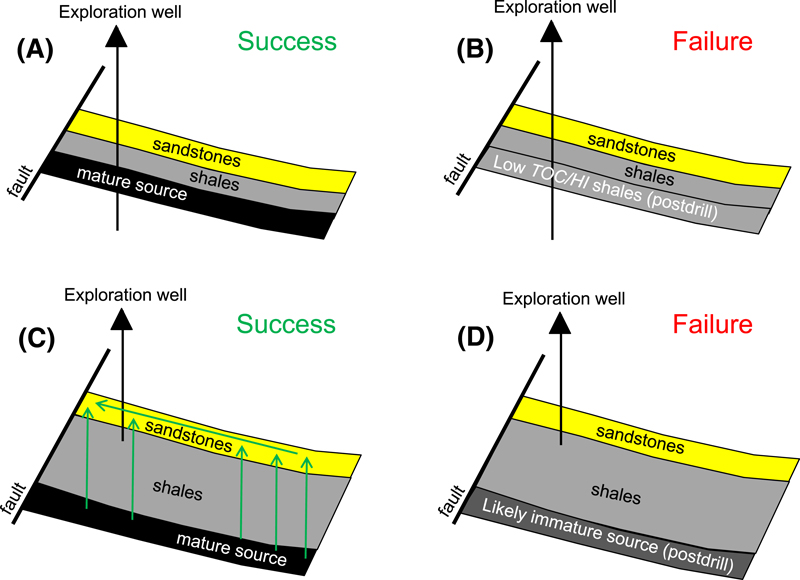 Figure 6. Examples of success (A, C) and failure (B, D) for the presence of mature source rocks. Green arrows in (C) indicate migration of petroleum from the source rock to the reservoir. HI = hydrogen index; TOC = total organic carbon.
The presence of mature source rocks is another element that is often difficult to establish in failed segments because exploration wells are typically not designed to directly test deeper source rocks. When the source is penetrated, interpretation of well logs, core data, and geochemical measurements (such as total organic carbon [TOC], hydrogen index [HI], temperature at which the maximum rate of petroleum generation occurs in a rock sample during pyrolysis analysis [Tmax], and vitrinite reflectance [Ro]) allows for the declaration of the presence or absence of mature source rocks (Figure 6A, B). When the predicted source rock has not been penetrated but the well contains petroleum shows or thermogenic gases (e.g., in mud–gas log or IsoTubes), success can be declared (Figure 6C). However, when no oil and gas shows or thermogenic gases are present, the failure mode may be migration rather than the presence of mature source (see below). Still, information from the well may help to establish the lack of mature source(s) as the failure mode. For example, temperature measurements from the drilled well may show that the area is significantly colder than assumed in the predrill model, meaning that the source rock would not be mature (Figure 6D). Modeling of burial history and source maturity calibrated to the data from the drilled well can help establish the source maturity failure.
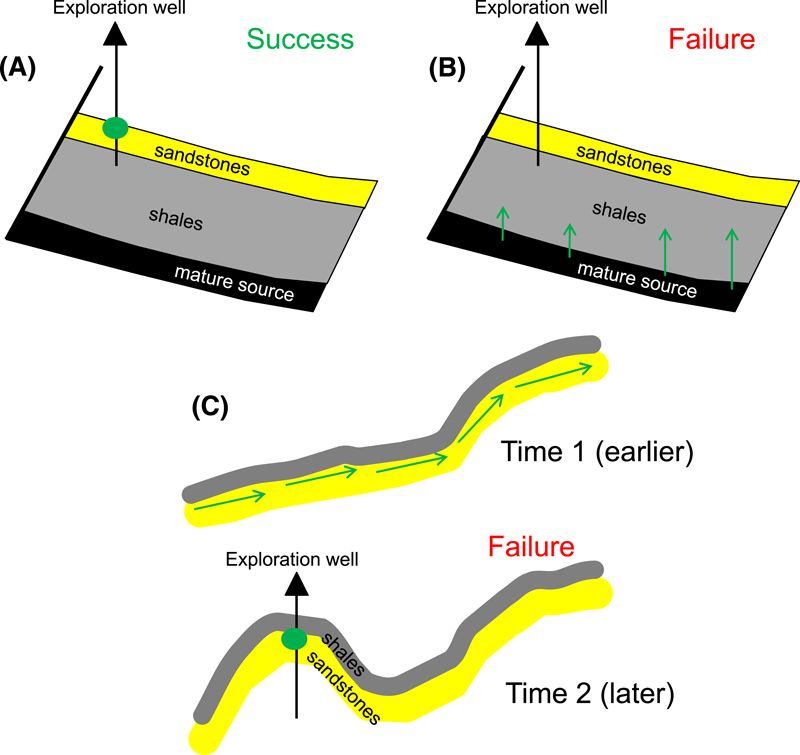 Figure 7. Examples of success (A) and failure (B, C) for petroleum migration. Green dots in (A) and (C) indicate the presence of petroleum shows and gas anomalies, suggesting that petroleum migrated through the segment. In the failure case described in (B), all petroleum fluids generated by the mature source rock were lost during the migration (see, for example, Milkov, 2015). In the failure case described in (C), the structure formed after petroleum migrated through the reservoir. Green arrows indicate petroleum migration pathways.
Petroleum migration success or failure is usually apparent from the study of oil and gas shows and gas observed in IsoTubes, mud–gas logs, and other gas samples (Figure 7A, B). However, even if petroleum shows are present in the reservoir, the segment may fail because there was no migration into the structure after the structure formed (timing issue, Figure 7C). Timing may be the failure mode and may be determined via the process of elimination if all other elements (structure, reservoir facies, etc.) are in place. Structural restoration and full three-dimensional (3-D) basin modeling may be necessary to confirm this failure mode.
DECISION TREE
Decision trees are useful visual tools that facilitate the decision process and drive consistency of evaluations. Our decision tree to determine the key failure mode for conventional segments is presented in Figure 8. The decision tree is a model in which questions with binary answers (yes or no) are asked, and the answers determine either the next question or the failure mode. The questions are arranged in order of simplicity, beginning with the easiest questions to answer and ending with the more difficult ones. For example, the presence of reservoir facies is arguably the easiest to determine because cuttings and common well logs are available for all exploration wells. Other failure modes may be more difficult to determine if the right data are not collected or are not reliable (e.g., oil or gas shows) or if there are no direct data (e.g., lateral seal not penetrated). In addition, some failure modes at the bottom of the decision tree are determined by the simple principle of elimination aligned with Sherlock Holmes’ saying, “Eliminate all other factors, and the one which remains must be the truth” (Doyle, 1890, p. 92).
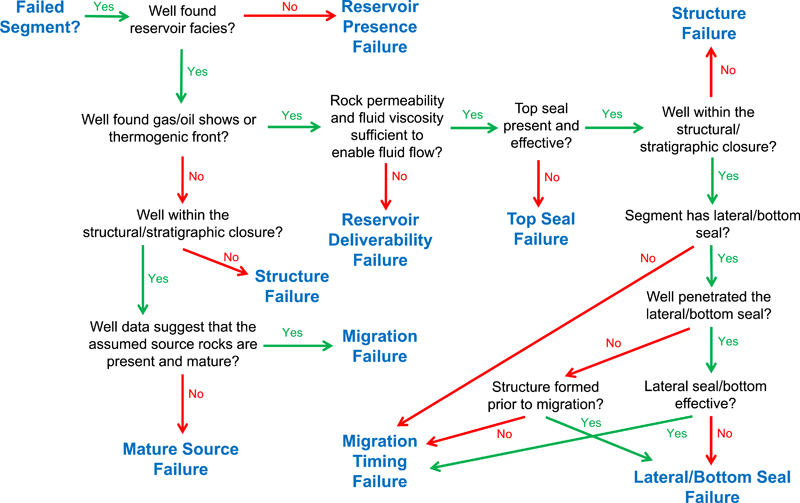 Figure 8. Decision tree to determine the failure mode for segments in conventional petroleum prospects.
The decision tree aims to establish the single failure mode for a given segment. However, the segment might fail for several reasons (e.g., Mathieu, 2018). For example, consider a well that penetrated subsurface intervals of predicted reservoir facies and source rock, yet both elements were absent. In our approach, using the decision tree, we would conclude that the segment failed because of the absence of reservoir facies, and the information regarding predicted source rock will be recorded and used to update the basin models, play fairways, and common risk segment maps. It is possible that the predicted source rock might be present in other areas of the basin or that other source rocks are present and could potentially provide petroleum charge to the segment. However, if the reservoir facies are absent in the drilled segment, then that is the key failure mode. Although this approach may be controversial, we prefer it for practical reasons. Having a single failure mode for segments makes the statistical analysis of play or basin failures more straightforward and the implementation of lessons learned more likely. Other approaches, such as tabulating and displaying observations for each risk element of the failed segment (e.g., Longley and Brown, 2016), are also valid but may be more cumbersome and less helpful for decision making.
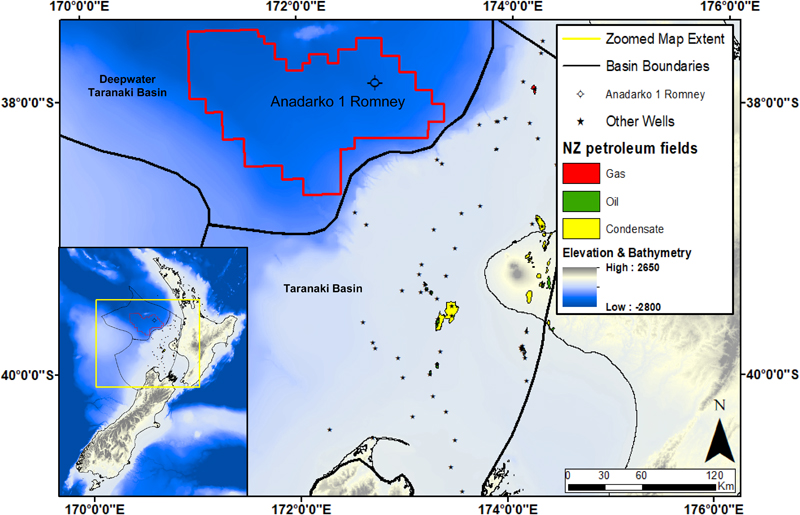 Figure 9. Location map for the Anadarko 1 Romney exploration well offshore New Zealand (NZ). The name of the permit (block) is PEP 38451.
The wells may be classified as dry for other reasons not covered above. For example, formation damage during drilling, especially in underpressured reservoirs, could result in the classification of the well as dry, but that well could be later re-entered or offset and completed as a discovery. Another possibility is that the operator incorrectly identified a potentially producing interval as dry. However, we do not discuss these failure modes in the decision tree (Figure 8) because we define success and failure based strictly on geological factors, given that the operator is prudent. Another nuance is that our decision tree works best for the wells located at or near the crest of the structure. For dry holes located far downdip the crest, there is a possibility that the tested segments contain a column of petroleum fluids updip from the well.
EXAMPLES OF USING THE DECISION TREE
North Cape Segment, Romney Prospect
Predrill Evaluation
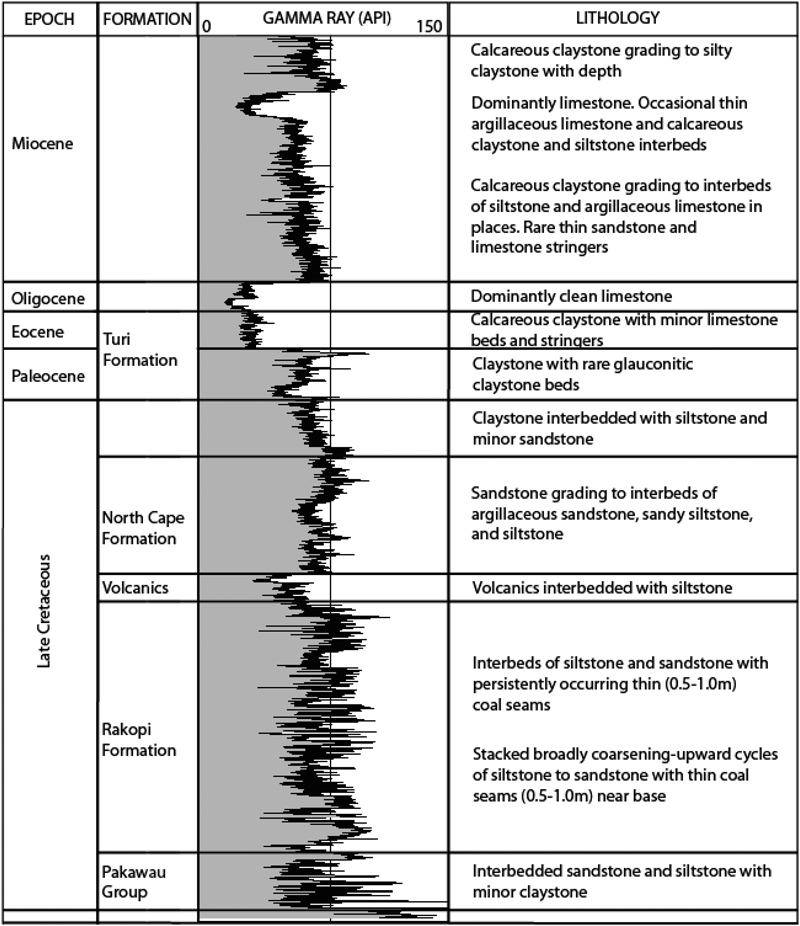 Figure 10. Generalized stratigraphy and lithology of the deep-water Taranaki Basin area at the Romney location. Gamma-ray log is from the Anadarko 1 Romney well. Although the Turi Formation is thought to have Oligocene age (e.g., Palmer, 1985), operator Anadarko assigned Paleocene–Eocene age to it (Anadarko New Zealand Taranaki Company, 2015).
The Romney prospect is located in the deep-water Taranaki Basin (permit PEP 38451) off the west coast of the North Island of New Zealand in approximately 1550 m (∼5085 ft) of water (Figure 9). The North Cape segment in the play of Upper Cretaceous transgressive-marine to nearshore and shoreface sandstone sequences of the Pakawau Group (North Cape Formation, Figure 10) was the primary drilling objective. In the predrill evaluation by operator Anadarko, the North Cape segment was described as a complex closure with updip amplitude-supported stratigraphic pinch-outs associated with a facies change and lateral sealing by a basement-offsetting Oligocene-aged fault (Figure 11).
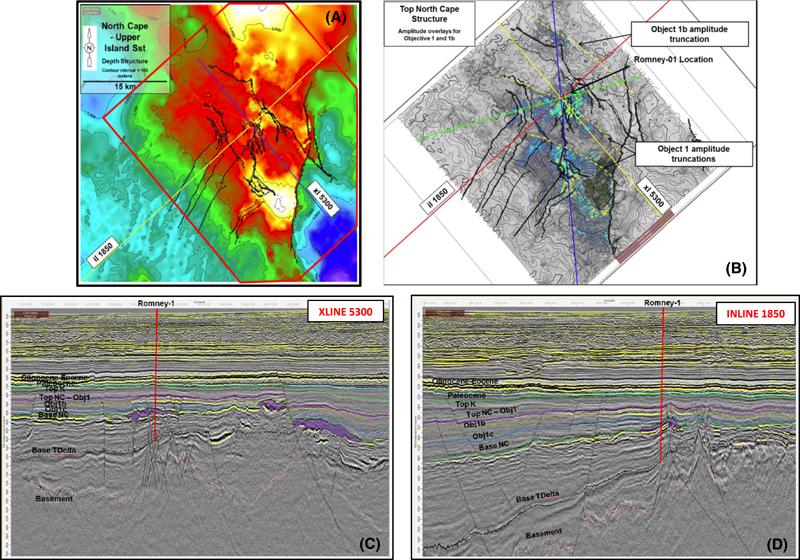 Figure 11. Predrill evaluation of the North Cape segment from the operator (Anadarko New Zealand Taranaki Company, 2015). (A) Predrill structure map. The depth ranges from approximately 4000 m (∼13,123 ft) below sea level (dark blue colors) to 3300 m (10,827 ft) below sea level (light yellow colors). (B) Predrill structure map with amplitude overlay. The section views of crossline (xl) 5300 (C) and inline (il) 1850 (D) showing predrill interpreted horizons, faults, and volcanics (purple areas). Base NC = base of the North Cape Formation; Base TDelta = base of the Taranaki delta group (Pakawau Group); Obj = objective; Sst = Sandstone; Top K = top Cretaceous; Top NC = top of the North Cape Formation; XLINE = crossline.
Transgressive prodelta shales located near the base of the Upper Cretaceous Pakawau Group (referred to as Taranaki delta group by Anadarko) were inferred as the main source rock. Despite numerous wells drilled in the Taranaki Basin, this predicted source interval had never been tested and thus was listed by Anadarko as the key geological risk. Two secondary source intervals were also predicted. The first is the overmature Upper Jurassic to Lower Cretaceous lacustrine shales interbedded with terrestrial coals underlying the Pakawau Group, and the second is the widespread coal measures within the Upper Cretaceous Rakopi Formation that are a proven source for many Taranaki Basin fields. However, Anadarko’s modeling has suggested that the coals within the Rakopi Formation are immature and that 80%–99% of in-place hydrocarbons would originate from the primary source (Anadarko New Zealand Taranaki Company, 2015).
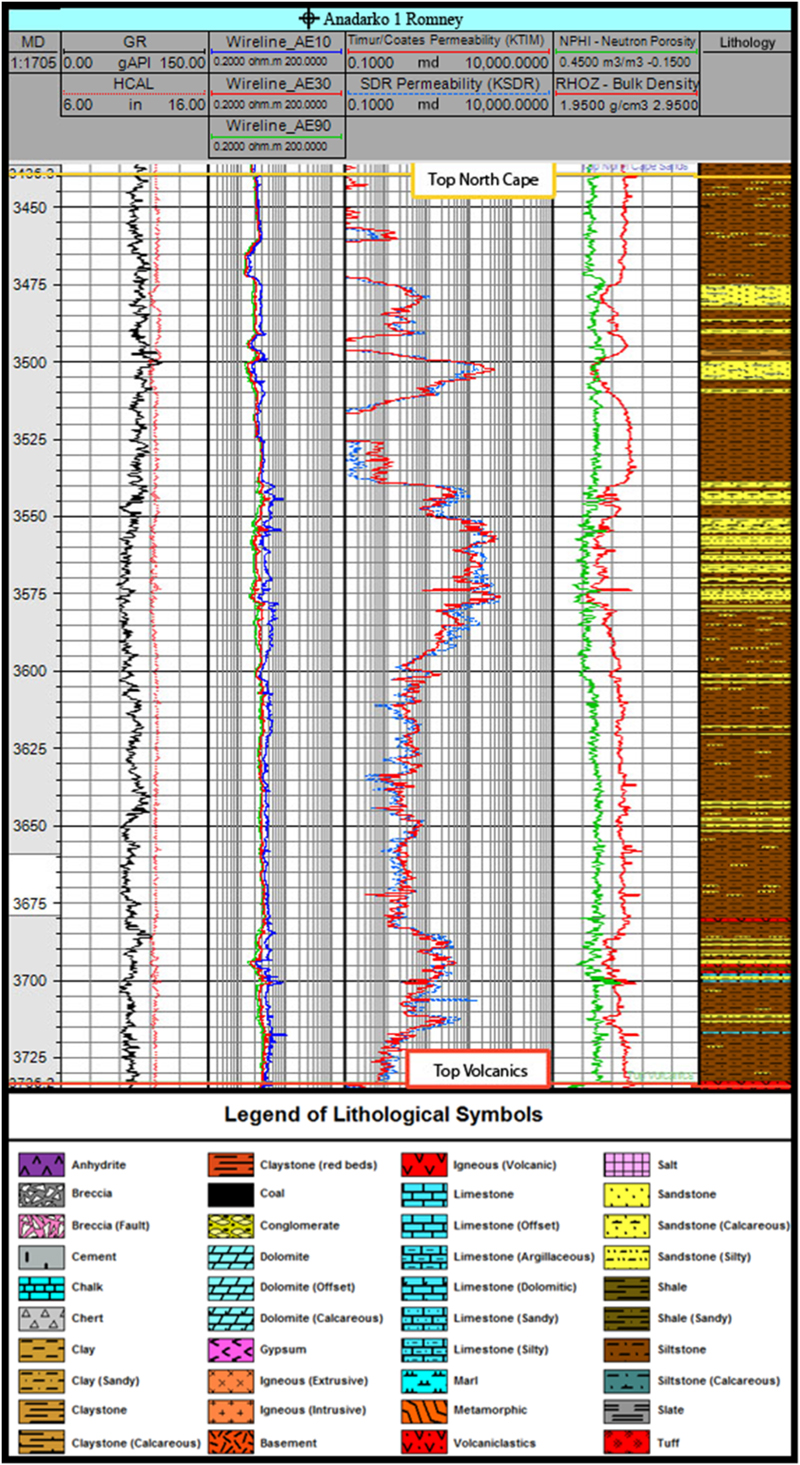 Figure 12. Measured depth (MD; in meters). Gamma ray (GR), caliper (HCAL), resistivity (AE10, AE30, and AE90), permeability (KTIM and KSDR), porosity (NPHI), and bulk density (RHOZ) curves as well as interpreted lithology throughout the North Cape interval in the Anadarko 1 Romney well. Data from Anadarko New Zealand Taranaki Company (2015). SDR = Schlumberger-Doll Research model.
The exploration well Anadarko 1 Romney (Anadarko 1 PEP 38451, the operator called it Romney-1) penetrated the segment in 2013–2014. There were no indications of movable petroleum fluids in the North Cape segment (Anadarko New Zealand Taranaki Company, 2015), so it failed.
Segment Failure Analysis
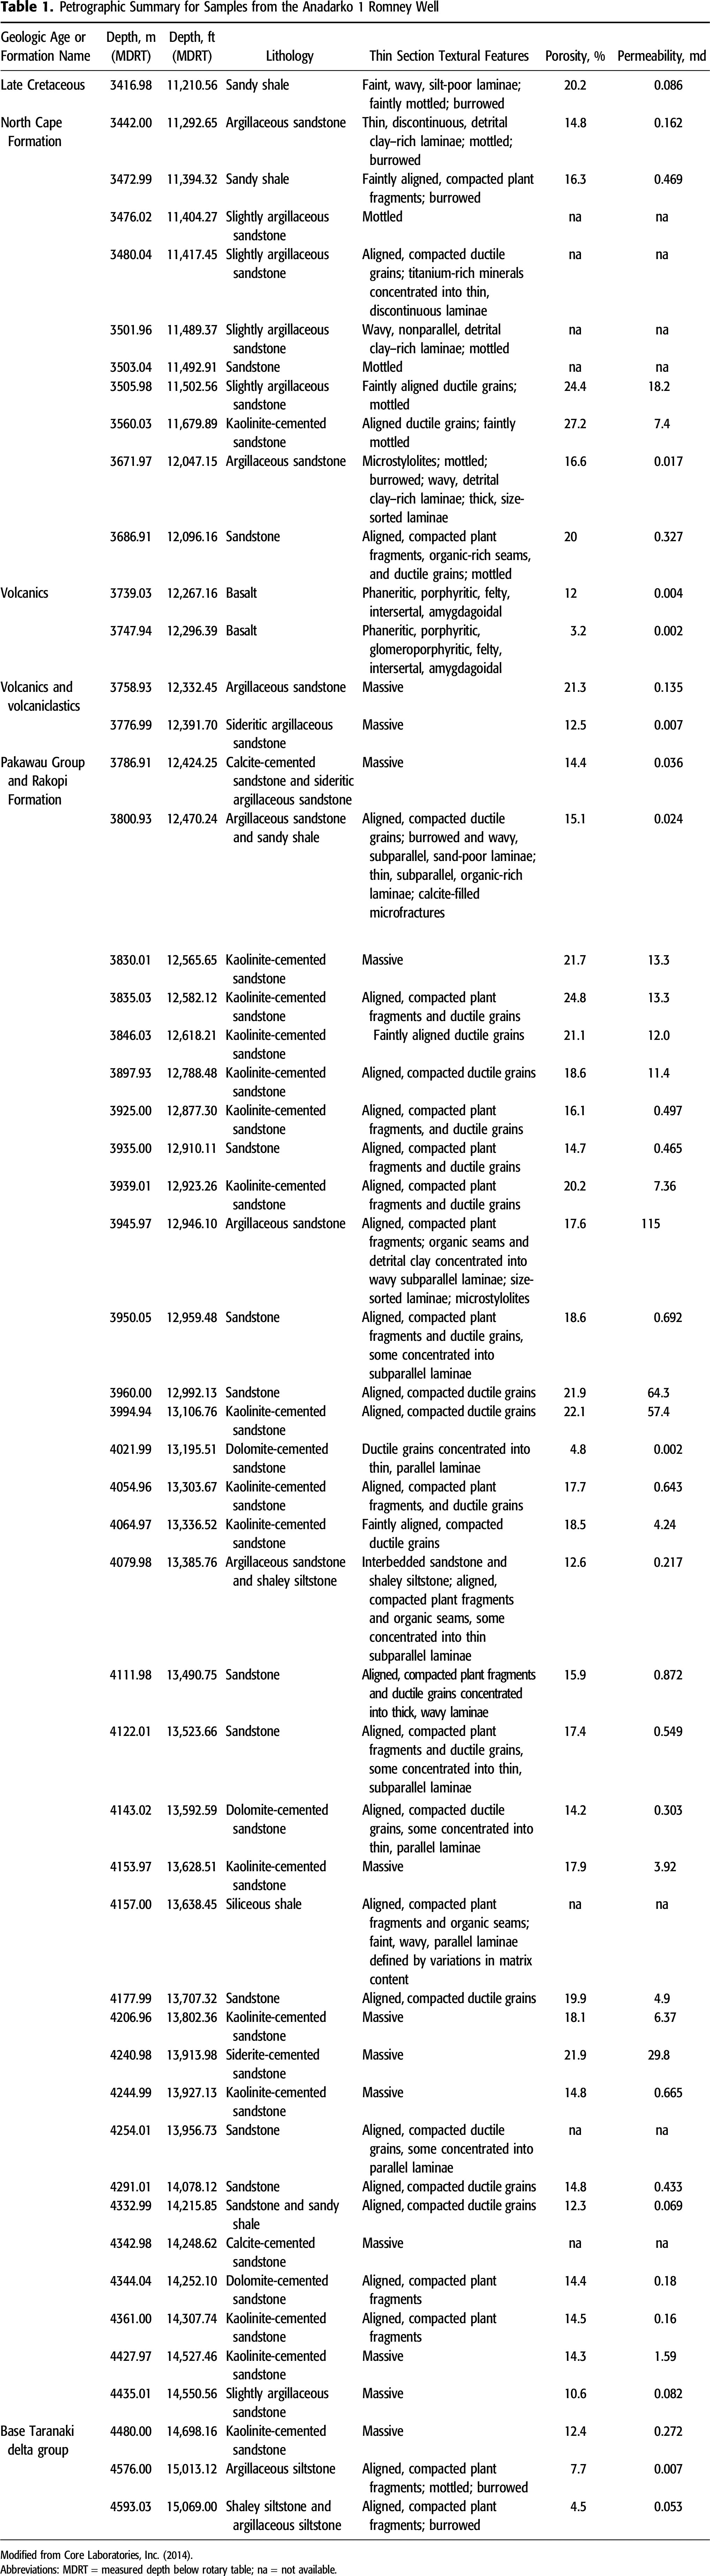
The top of the North Cape sandstones was picked at 3429 m (11,250 ft) measured depth below rotary table (MDRT), 6 m (20 ft) above prognosis (Anadarko New Zealand Taranaki Company, 2015). All depth values below are reported as MDRT, whereas the drilling floor for Anadarko 1 Romney well was 25 m (82 ft) above sea level, and water depth was 1546.6 m (5074 ft). Various well-logging tools and curves were used to aid in the identification of distinctive lithologies within the target interval. In addition to well logs, a detailed petrologic analysis of rotary sidewall cores was completed by Core Laboratories, Inc. (2014). Ten samples from the North Cape segment underwent detailed thin section petrographic analysis, with scanning electron microscopy (SEM) on five samples and x-ray diffraction (XRD) on four samples (Table 1). These petrologic reports used in conjunction with the well logs confirmed the presence of a 294-m (965-ft)-thick reservoir interval of primarily siltstone interbedded with sandstone. Of that 294-m (965-ft) interval, approximately 61 m (∼200 ft) total are sandstone layers ranging in thickness from 0.5 to 7 m (1.6–23 ft).
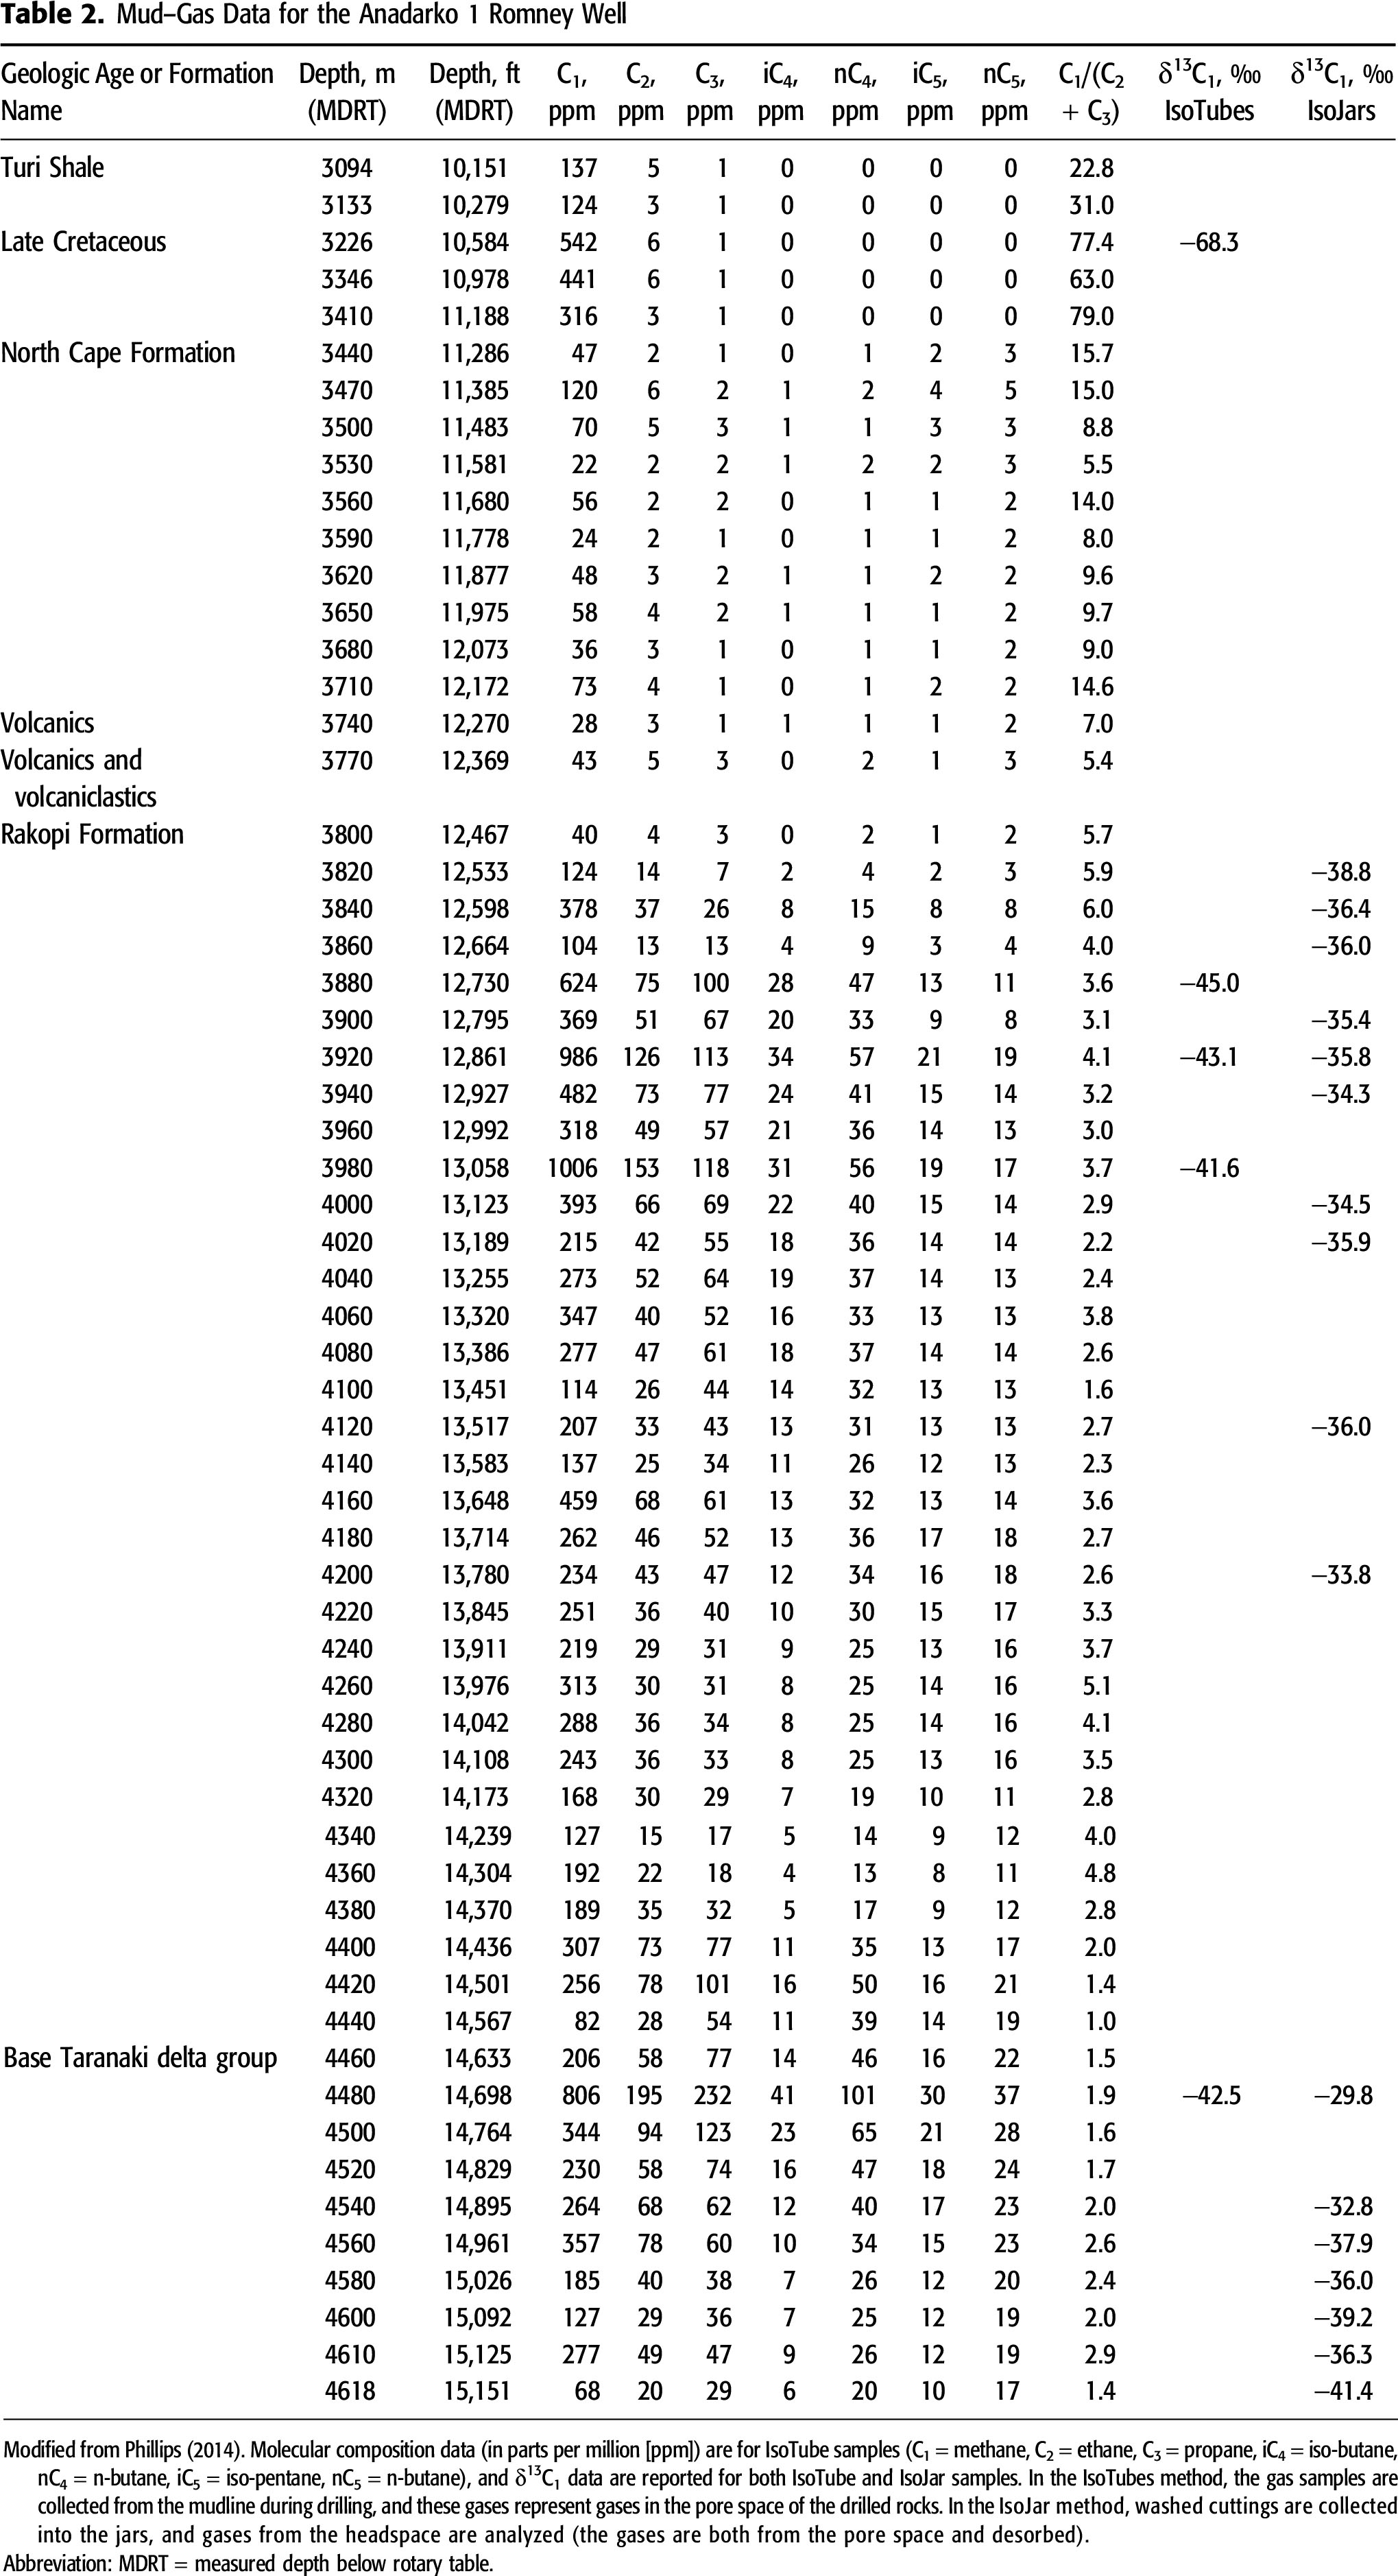
After confirming the presence of the reservoir facies, the workflow then proceeds to the evaluation and identification of the existence, or lack thereof, of petroleum shows or thermogenic gases (Figure 8). Based on data from the conventional mud logging gas system, the North Cape Formation is characterized by low background gas mostly at approximately 0.01% and no gas shows (peaks). Although very poor and poor oil shows were reported from intervals of 3469–3509 m (11,381–11,512 ft), they were interpreted to be caused by an oil-based mud additive because petrophysical evaluations and modular formation dynamics tester (MDT) pretests did not suggest the presence of any movable oil in this interval (Anadarko New Zealand Taranaki Company, 2015). Table 2 presents the molecular and isotopic composition of gases from the Anadarko 1 Romney well as measured in IsoTubes and IsoJars. The North Cape Formation and gases within it are represented by the values in Table 2 between the depths of 3440–3710 m (11,286–12,172 ft). Although the ratio of C1/(C2 + C3) within the segment is relatively low (from 5 to 16) and may suggest thermogenic origin of the gas, the concentration of C1–C5 gases is very low. The concentration of C1 is 22–120 ppm, and concentrations of individual C2–C5 gases do not exceed 6 ppm in the IsoTubes. Because of such low concentrations, no δ13C measurements were made. The only gas sample above the North Cape segment with an available δ13C1 value is from a depth of 3226 m (10,584 ft), approximately 200 m (∼656 ft) above the top of the reservoir and within the seal. This sample has a C1/(C2 + C3) value of 77 and a δ13C1 value of −68.3‰ and has either microbial or early mature in situ thermogenic origin or a mixture of them (Milkov and Etiope, 2018). The study of thin sections from sidewall cores revealed a high abundance of oil inclusions (orange and white fluorescent in carbonate cement) in sandstones from 3501.96 m (11,489 ft), 3505.98 m (11,503 ft), and 3935 m (12,910 ft), suggesting elevated oil saturation in these sandstones at some time (Fluid Inclusion Technologies, Inc., 2014). However, these fluid inclusions data contradict the apparent lack of oil-related mature thermogenic gases in the pore space of sandstones in the North Cape Formation, evidenced by mud logging and IsoTubes data. Despite the presence of the expected predrill reservoir facies, there is no firm evidence of petroleum shows or thermogenic gases in the North Cape segment, requiring further analysis on the segment’s specific failure mode and moving forward on the decision tree to an investigation into structure.
The predicted predrill trap for the North Cape segment was a stratigraphic pinch-out associated with a facies change and lateral trapping by a fault (Figure 11; Anadarko New Zealand Taranaki Company, 2015). Our postdrill mapping, using the same 3-D seismic data as available to the operator and the top North Cape Formation tied to the well, confirmed the presence of a low-relief fault-bounded structure (Figure 13). The well penetrated the top of the segment 6 m (20 ft) downdip from the crest of the structure. The predrill top seal for the North Cape segment was predicted to be claystones interbedded with siltstones and sandstones. We used both well logs (Figure 14) and core data (Table 1) to confirm that these sealing facies are indeed present, although our decision tree (Figure 8) does not require a test for top seal at this stage of key failure analysis.
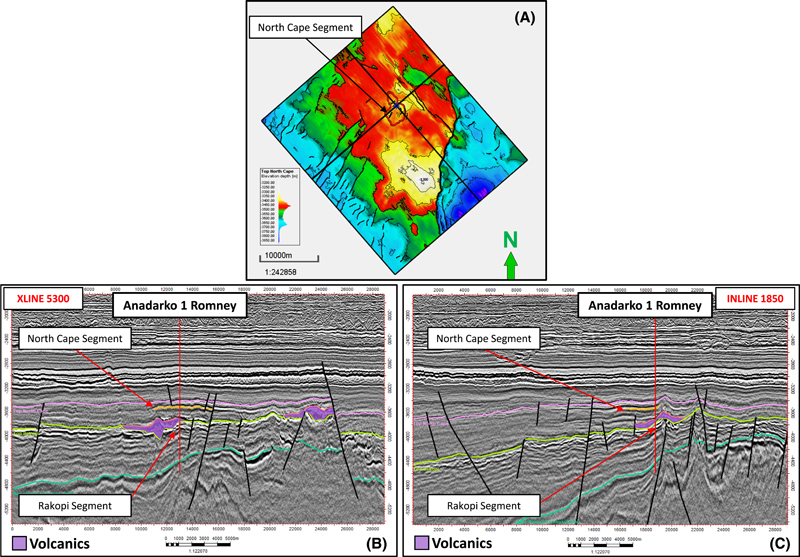 Figure 13. Postdrill structure map of the North Cape segment (A), crossline (XLINE) 5300 (B), and inline 1850 (C) as interpreted in this study.
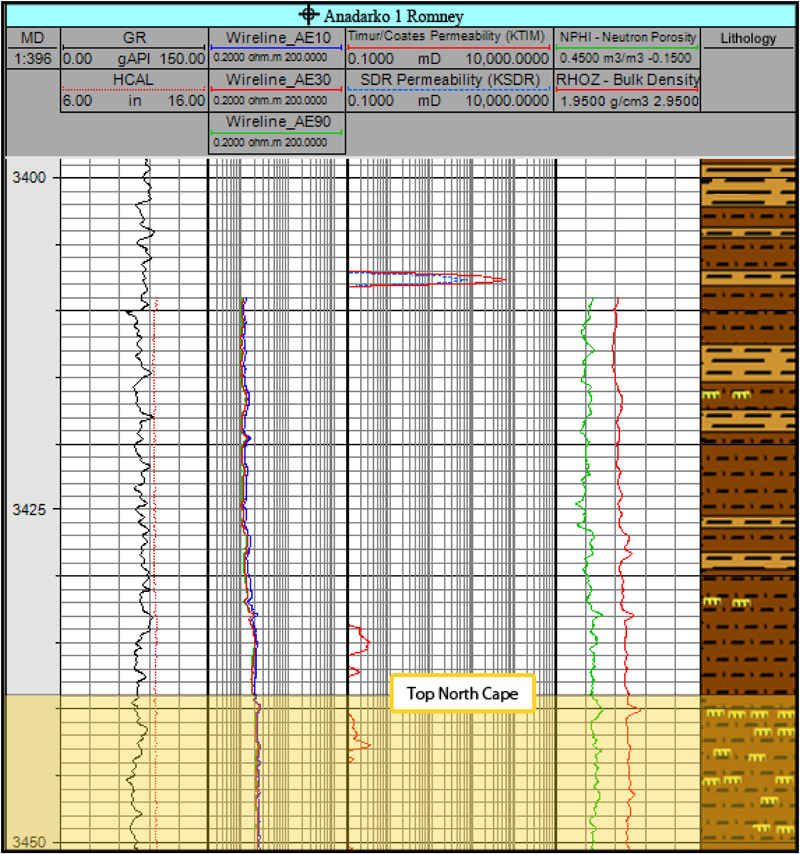 Figure 14. Measured depth (MD; in meters). Gamma ray (GR), caliper (HCAL), resistivity (AE10, AE30, and AE90), permeability (KTIM and KSDR), porosity (NPHI), and bulk density (RHOZ) curves. Well logs showing the top of the North Cape interval and the overlying top seal (modified from Anadarko New Zealand Taranaki Company, 2015). See Figure 12 for the legend of lithological symbols. SDR = Schlumberger-Doll Research model.
The well penetrated the predicted primary source rock interval, which was transgressive prodelta shales located near the base of the Pakawau Group and Rakopi Formation. This interval from 4441 to 4619 m (14,570–15,154 ft) (well total depth [TD]) is dominated by interbedded sandstones and siltstones. The deepest penetrated section from 4586–4619 m (15,046–15,154 ft) is composed of carbonaceous siltstones with relatively high gamma-ray readings. Based on the measurements of TOC, HI, Tmax, and Ro (Figure 15), mature source rocks are present in this interval. Macerals are apparently dominated by inertinite, whereas liptinite is sparse to rare, but that could be because of a strong fluorescence of mineral matter masking some weak fluorescing liptinite (Phillips, 2014). The source rocks are mature (Tmax: 452–457°C; mean Ro: 0.94%–0.98%) and have measured values of TOC between 1.2–3.1 wt. % and HI between 138–184 mg HC/g TOC. The source rocks could have original (before maturation and expulsion) average values of TOC at approximately 2.5–3.5 wt. % and HI at approximately 300 mg HC/g TOC (estimated with online source rock potential calculator from ZetaWare, Inc.). Based on these data, the penetrated source rock has “fair” or “good” initial generative potential (Peters, 1986). Additional source potential exists in a shallower section within the Rakopi Formation, characterized by the presence of mature shale intervals (with original HI ∼350–400 mg HC/g TOC). There are also coal measures within the Rakopi Formation, but coals are probably not sufficiently mature to expel significant petroleum fluids (Figure 15) because coals require higher thermal stress than shales to expel oil or gas (Pepper and Corvi, 1995). The presence of thermogenic gas in the Rakopi Formation (Table 2, see below) confirms the presence of mature source rocks in the area of the Romney prospect.
Figure 15. (A) Total organic carbon (TOC; wt. %), (B) hydrogen index (HI; mg C/g TOC), (C) temperature at which the maximum rate of petroleum generation occurs in a rock sample during pyrolysis analysis (Tmax; °C) and (D) vitrinite reflectance (Ro; %) values measured on solvent-extracted samples from sidewall cores taken by mechanical sidewall coring tool in the Anadarko 1 Romney well (data from Phillips, 2014). Fm = Formation.
Based on the proposed workflow (Figure 8) and the data and interpretations described above, migration is determined as the failure mode for the North Cape segment. Although mature source rocks are present, and thermogenic hydrocarbons occur in the deeper section below approximately 3820 m (∼12,533 ft) (Table 2), these hydrocarbons apparently did not migrate into the North Cape segment. This may be because of the presence of relatively impermeable volcanic rocks at the base of the North Cape section (Figure 13; Table 2).
Rakopi Segment, Romney Prospect
Predrill Evaluation
The Rakopi segment in the Romney prospect was the secondary objective of the Anadarko 1 Romney well. This segment is located within the play of Upper Cretaceous fluvio-deltaics and the nearshore sandstone sequences of the Rakopi Formation (Figure 10) within the Pakawau Group (Taranaki delta group, Anadarko New Zealand Taranaki Company, 2015). It was modeled as a three-way structure with a combination of volcanics and faults providing the updip lateral seal (Figure 16). Similar to the North Cape segment discussed above, the primary source interval was inferred to be the transgressive prodelta shales near the base of the Pakawau Group sequence. Because that interval had not been drilled in New Zealand before, source presence and quality were determined as the key geological risks for the Rakopi segment. The Anadarko 1 Romney well penetrated the segment but found no movable petroleum fluids (Anadarko New Zealand Taranaki Company, 2015), so the segment failed.
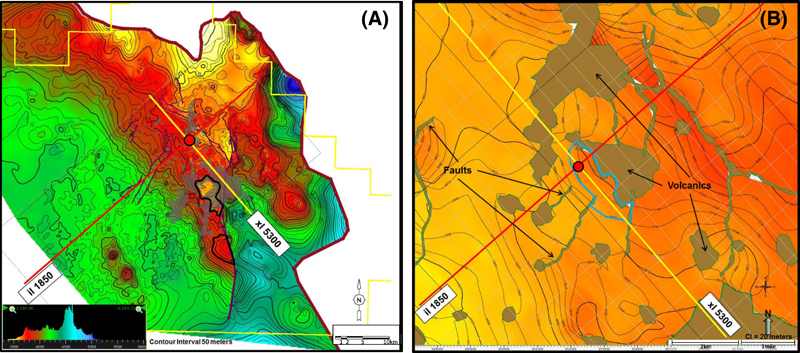 Figure 16. Predrill evaluation of the Rakopi segment from the operator (Anadarko New Zealand Taranaki Company, 2015). (A) Smaller-scale predrill structure map. Color scale in the insert indicates depth of the segment ranging from approximately 3400 to 5200 m (∼11,155 ft [yellow] to 17,060 ft [blue]). (B) Zoomed-in predrill map from the operator, showing the outline of the Rakopi segment as a blue polygon and the volcanics as green polygons. il = inline; xl = crossline.
Segment Failure Analysis
The top of the Rakopi Formation was picked at 3784 m (12,415 ft), 4 m (13 ft) lower, relative to prognosis (Anadarko New Zealand Taranaki Company, 2015). Various well-logging tools and curves were used to aid in the identification of distinctive lithologies within the target interval (Figure 17). Core analyses included detailed thin section petrography on 34 samples, XRD on 16 samples, and SEM on 20 samples (Core Laboratories, Inc., 2014). Interpretation of petrologic reports in conjunction with the well logs confirmed the presence of a 657-m (2156-ft)-thick interval of interbedded sandstones and siltstones with abundant coal seams typically ranging in thickness from 0.5 to 1 m (1.6–3.3 ft) and up to 3 m (9.8 ft) at certain depths. Of that 657-m (2156-ft) interval, approximately 298 m (∼978 ft) total are sandstones ranging in thickness from 0.3 to 80 m (1–262 ft) (Anadarko New Zealand Taranaki Company, 2015).
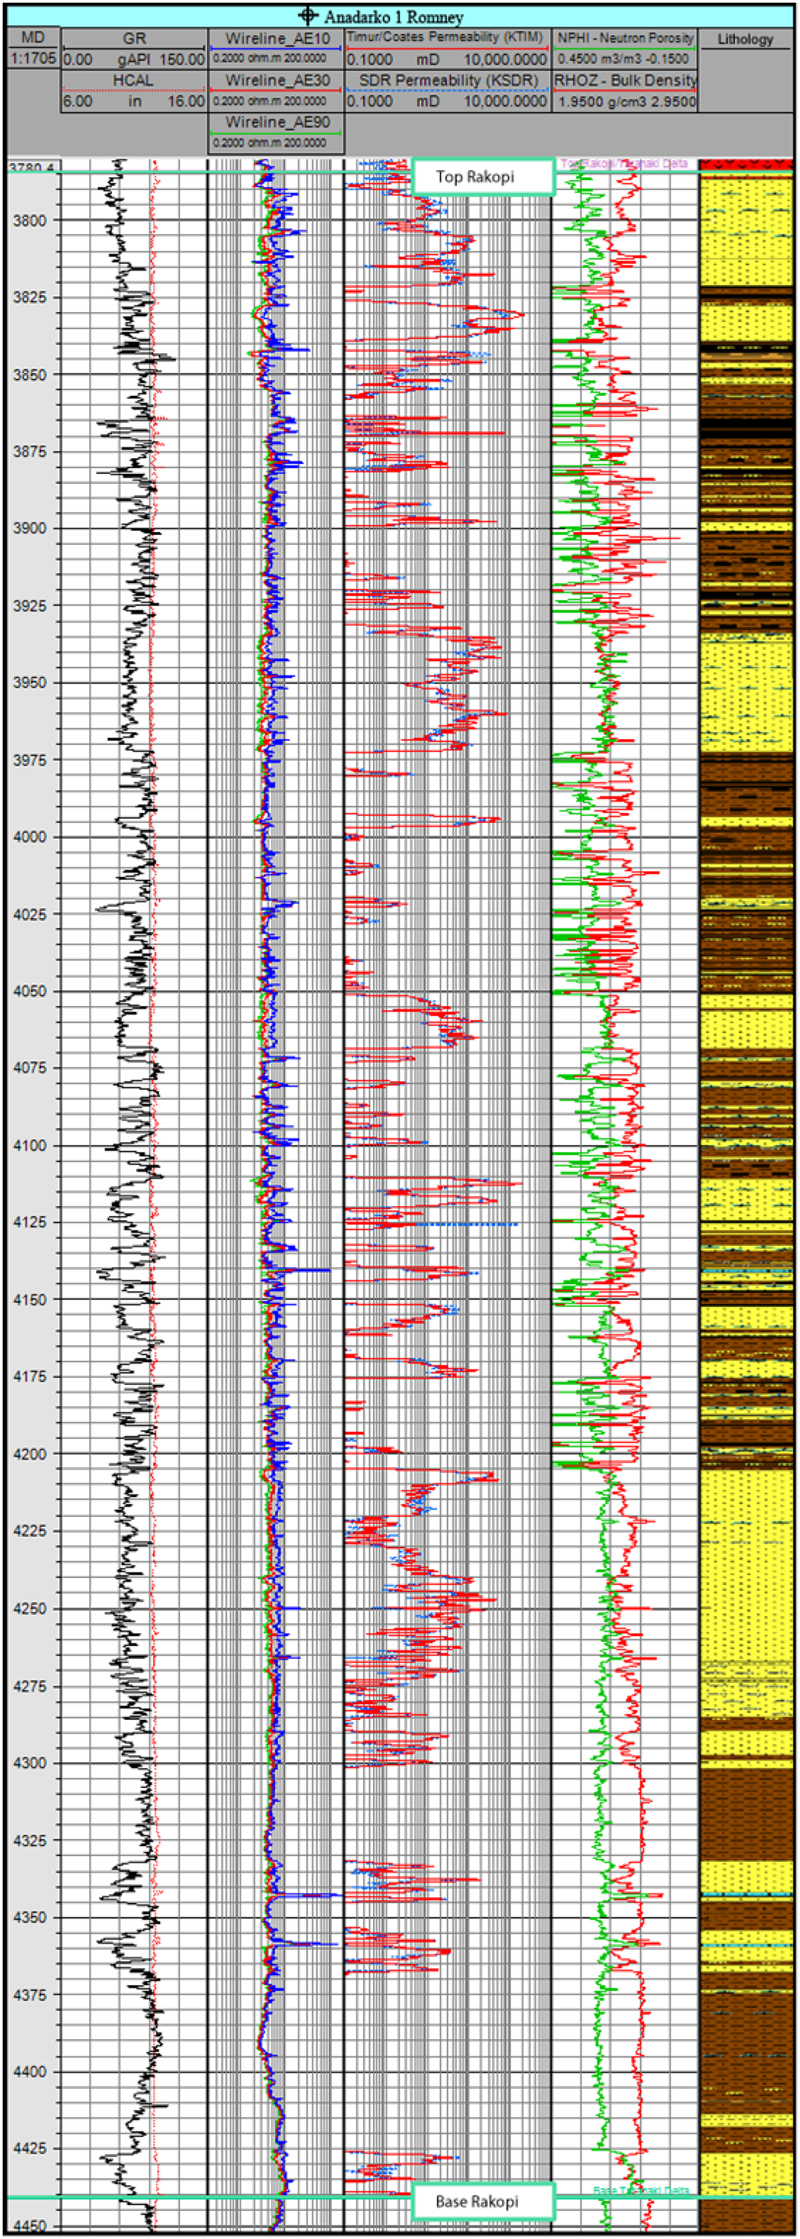 Figure 17. Measured depth (MD; in meters). Gamma ray (GR), caliper (HCAL), resistivity (AE10, AE30, and AE90), permeability (KTIM and KSDR), porosity (NPHI), and bulk density (RHOZ) curves as well as interpreted lithology throughout the Rakopi interval in the Anadarko 1 Romney well. Data from Anadarko New Zealand Taranaki Company (2015). See Figure 12 for the legend of lithological symbols. SDR = Schlumberger-Doll Research model.
Data from the conventional mud logging gas system indicate a significant increase in background gas, the appearance of C2–C5 hydrocarbons, and gas peaks below 3818 m (12,526 ft). This was coincident with the appearance of coal seams and carbonaceous claystones in the drilled section. Very poor to fair oil shows were reported in the interval of 3896–3950 m (12,782–12,959 ft) and were interpreted to be caused by an oil-based mud additive. No movable oil was found through petrophysical evaluations and an MDT test at 3941.2 m (12,930 ft) (Anadarko New Zealand Taranaki Company, 2015). Gas samples from the Rakopi Formation have significantly (one order of magnitude) higher concentrations of C1–C5 gases than samples from the North Cape Formation discussed above (Table 2; Phillips, 2014). The values of C1/(C2 + C3) less than 6 and δ13 of C1 at approximately −42‰ to −45‰ in IsoTube samples are consistent with the thermogenic origin of the gas (Milkov and Etiope, 2018). The Rakopi Formation contains shales and coal measures with abundant liptinite macerals, present-day TOC values of 1%–70%, and HI values of 179–403 mg HC/g TOC. These samples have Tmax values of 426–444°C and Ro values of 0.49%–0.76% (Phillips, 2014), with the deeper shales being in the early maturity window (Figure 15). Therefore, some thermogenic gases observed in the Rakopi Formation could be generated within that formation. An additional charge of thermogenic gases is possible from the deeper source rocks penetrated near the bottom of the well (base of the Pakawau Group) or deeper Jurassic–Cretaceous source rocks not yet proven in New Zealand.
Based on the petrologic analyses from Core Laboratories, Inc. (2014) (Table 2) as well as the various well logs shown in Figure 17, the average porosity and permeability throughout the Rakopi Formation sandstones are 17% and 12.1 md, respectively. The upper part of the formation, where the segment is located, has sandstones with porosities exceeding 20% in some samples. These values are sufficient to ensure the flow of light to medium oil and gas and allows for the elimination of reservoir deliverability as the failure mode for the Rakopi segment.
The Rakopi sandstone reservoir is sealed at the top by volcanic and volcaniclastic facies as confirmed by both well logs (Figure 18) and core data (Table 1). These sealing facies have permeability as low as 0.002 md in basalts, although volcanoclastic argillaceous sandstones may be more permeable (up to 0.135 md) (Core Laboratories, Inc., 2014). The sealing capacity of volcanics above the Rakopi Formation is collaborated by the fact that the North Cape section overlaying the volcanics does not contain thermogenic gases, although thermogenic gases are present below the volcanics (as evidenced by the IsoTube data, Table 2)
 Figure 18. Measured depth (MD; in meters). Gamma ray (GR), caliper (HCAL), resistivity (AE10, AE30, and AE90), permeability (KTIM and KSDR), porosity (NPHI), and bulk density (RHOZ) curves as well as interpreted lithology showing the top of the Rakopi Formation and the overlying volcanics acting as a top seal (modified from Anadarko New Zealand Taranaki Company, 2015). See Figure 12 for the legend of lithological symbols. SDR = Schlumberger-Doll Research model.
The postdrill mapping of the well-tied top Rakopi (base volcanics) horizon and faults confirms the presence of a three-way (fault-bounded) structural trap (Figure 19). The well penetrated the top of the segment 111 m (364 ft) downdip from the crest of the structure.
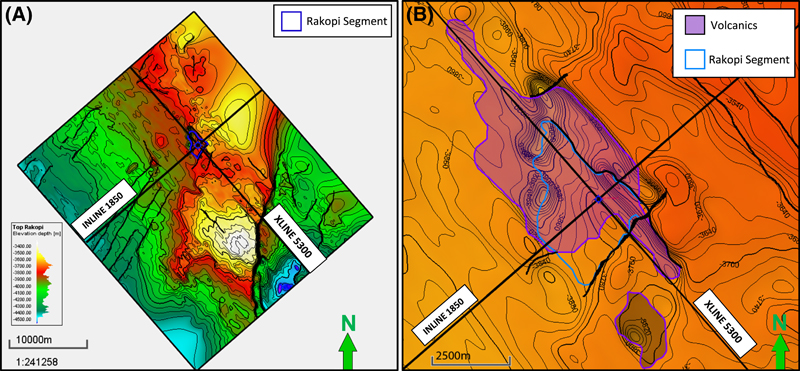 Figure 19. (A) Postdrill structure map of the Rakopi segment. (B) Zoomed-in map showing the outline of the Rakopi segment and the volcanics. XLINE = crossline.
The predicted predrill lateral seal for the Rakopi segment was a combination of volcanics and faults for the upper sandstones within the Rakopi Formation, with the lower sandstones sealing against localized Cretaceous faults (Figure 11, 16). Postdrill seismic interpretations have confirmed the presence of both the volcanics and lateral faults (Figures 18, 19). The Anadarko 1 Romney well did not penetrate the lateral seal for the Rakopi segment.
Moving along the decision tree (Figure 8), we now investigate whether or not the structure formed prior to petroleum migration. Maturity data from the base of the Pakawau Group section near TD (maximum Tmax: 457°C; maximum mean Ro: 0.98%) suggest that the source facies are in the middle to late oil window and are still actively expelling petroleum. Furthermore, the Rakopi Formation contains early mature shales that likely currently expel petroleum. Process of elimination by means of the establishment and verification of all other potential failure modes (Figure 8) leads to the conclusion that the Rakopi segment failed because of a lack of effective lateral seal. However, because the well penetrated this secondary target approximately 111 m (∼364 ft) downdip from the crest of the structure, it is possible that a petroleum accumulation exists in the Rakopi segment updip from the well if the lateral seal is effective.
CONCLUSIONS
Petroleum exploration is a risky business in which dry holes are common. Each such failure is painful. However, when explorers face up to failures, identify the mistakes in predrill subsurface models, and apply the lessons learned from failed segments, these errors of the past become exploration wisdom and lead to future success. In order for the postdrill results to be useful, the failure modes must be determined correctly and consistently. The proposed decision tree facilitates identification of the key failure mode for segments in conventional prospects, as demonstrated for the dry Anadarko 1 Romney well. We believe that this tree, or its customized versions, will serve as a valuable tool in postdrill assessments and will help increase the return on exploration failures. The method described in this paper has, to date, met all of the objectives of early evaluation but will continue to be tested on other exploration wells from varying sedimentary basins.
REFERENCES CITED
Anadarko New Zealand Taranaki Company, 2015, PEP 38451 Romney-1 well completion report: Wellington, New Zealand, New Zealand Petroleum and Minerals, Ministry of Business, Innovation & Employment, Petroleum Report PR4951, 980 p., accessed October 15, 2017, https://data.eat.nzpam.govt.nz.
American Oil and Gas Historical Society, 2018, First dry hole, accessed September 15, 2018, https://aoghs.org/technology/first-dry-hole/.
Ayres, I., 2007, Super crunchers: Why thinking-by-numbers is the new way to be smart: Bantam, New York, 272 p.
Birkinshaw, J., and M. Haas, 2016, Increase your return on failure: Harvard Business Review, v. 94, no. 5, p. 88–93.
Chellingsworth, L., M. Bentley, and T. Wynn, 2015, Human factors in seismic uncertainty—Restoring a realistic uncertainty range: Interpretation, v. 3, no. 2, p. SQ21–SQ32, doi:10.1190/INT-2014-0203.1.
Citron, G., M. Bond, and P. Carragher, 2017, Exploration assurance team best practices: AAPG Search and Discovery article 70264, accessed December 15, 2018, http://www.searchanddiscovery.com/pdfz/documents/2017/70264citron/ndx_citron.pdf.html.
Citron, G. P., P. J. Brown, J. Mackay, P. Carragher, and D. Cook, 2018, The challenge of unbiased application of risk analysis towards future profitable exploration, in M. Bowman and B. Levell, eds., Petroleum geology of NW Europe: 50 years of learning: Proceedings of the 8th Petroleum Geology Conference, London, September 28–30, 2015, p. 259-266, doi:10.1144/PGC8.2
Core Laboratories, Inc., 2014, Petrologic analysis of rotary sidewall core samples for Anadarko New Zealand Company Romney-1 Well NZ Block PEP 38451, 130 p., accessed October 15, 2017, https://data.eat.nzpam.govt.nz.
Doyle, A. C., 1890, The sign of the four: Re-printed in The Penguin Complete Sherlock Holmes: London, Viking, 1981, 1128 p
Fluid Inclusion Technologies, Inc., 2014, A stratigraphic reconstruction of bulk volatile chemistry from fluid inclusions in Romney-1. Report prepared for Anadarko, 168 p., accessed October 15, 2017, https://data.eat.nzpam.govt.nz.
Grant, S., N. Milton, and M. Thompson, 1996, Play fairway analysis and risk mapping: An example using the Middle Jurassic Brent Group in the northern North Sea, in A. G. Doré and R. Sinding-Larsen, eds., Quantification and prediction of petroleum resources: Oslo, Norway, Norwegian Petroleum Society Special Publication 6, p. 167–181, doi:10.1016/S0928-8937(07)80017-8
Halbouty, M. T., 1970, Geology of giant petroleum fields: AAPG Memoir 14, 575 p.
Halbouty, M. T., 1980, Giant oil and gas fields of the decade, 1968–1978: AAPG Memoir 30, 596 p.
Halbouty, M. T., 1992, Giant oil and gas fields of the decade, 1978–1988: AAPG Memoir 54, 526 p.
Halbouty, M. T., 2003, Giant oil and gas fields of the decade, 1990–1999: AAPG Memoir 79, 340 p.
Laver, R., T. Randen, and S. Warner, 2012, How geoscience decisions support software tools have evolved and what it means for E&P companies: First Break, v. 30, p. 121–126.
Loizou, N., 2005, West of Shetland exploration unraveled —An indication of what the future may hold: First Break, v. 23, no. 1088, p. 53–59, doi:10.3997/1365-2397.2005020.
Loizou, N., I. J. Andrews, S. J. Stoker, and D. Cameron, 2006, West of Shetland revisited: The search for stratigraphic traps, in M. R. Allen, G. P. Goffey, R. K. Morgan, and I. M. Walker, eds., The deliberate search for the stratigraphic trap: Geological Society, London, Special Publications 2006, v. 254, p. 225–245, doi:10.1144/GSL.SP.2006.254.01.12
Longley, I. M., 2012, Valuable dusters—Not an oxymoron: Petroleum Play Assessment Workshop, Malaga, Spain, February 13–15, 2012, abstract A008.
Longley, I., and J. Brown, 2016, Why bother? (with play based exploration): The five reasons why play based exploration worthwhile in a modern busy understaffed and overworked exploration company environment: AAPG Search and Discovery article 110227, accessed January 15, 2018, http://www.searchanddiscovery.com/documents/2016/110227longley/ndx_longley.pdf.
Mathieu, C., 2015, Moray Firth—Central North Sea post well analysis: London, Oil & Gas Authority, 208 p.
Mathieu, C. J. H., 2018, Exploration well failures from the UK North Sea, in M. Bowman and B. Levell, eds., Petroleum geology of NW Europe: 50 years of learning: Proceedings of the 8th Petroleum Geology Conference, London, September 28–30, 2015, p. 267-272, doi:10.1144/PGC8.3
Merrill, R. K., and C. A. Sternbach, 2017, Giant fields of the decade, 2000–2010: AAPG Memoir 113, 322 p.
Milkov, A. V., 2015, Risk tables for less biased and more consistent estimation of probability of geological success (PoS) for segments with conventional oil and gas prospective resources: Earth-Science Reviews, v. 150, p. 453–476, doi:10.1016/j.earscirev.2015.08.006.
Milkov, A. V., 2017, Integrate instead of ignoring: Base rate neglect as a common fallacy of petroleum explorers: AAPG Bulletin, v. 101, no. 12, p. 1905–1916, doi:10.1306/0327171622817003.
Milkov, A. V., and G. Etiope, 2018, Revised genetic diagrams for natural gases based on a global data set of >20,000 samples: Organic Geochemistry, v. 125, p. 109–120, doi:10.1016/j.orggeochem.2018.09.002.
Milkov, A. V., and W. C. Navidi, 2020, Randomness, serendipity, and luck in petroleum exploration: AAPG Bulletin, v. 104, No. 1, p. 145–176, doi:10.1306/05061918128.
Norman, C. D., 2012, Assessing combination traps: Using risk to define uncertainty: First Break, v. 30, no. 3, p. 49–53.
Palmer, J., 1985, Pre-Miocene lithostratigraphy of Taranaki Basin, New Zealand: Journal of Geology and Geophysics, v. 28, no. 2, p. 197–216, doi:10.1080/00288306.1985.10422220.
Pepper, A. S., and P. J. Corvi, 1995, Simple kinetic models of petroleum formation. Part III: Modelling an open system: Marine and Petroleum Geology, v. 12, no. 4, p. 417–452, doi:10.1016/0264-8172(95)96904-5.
Peters, K. E., 1986, Guidelines for evaluating petroleum source rock using programmed pyrolysis: AAPG Bulletin, v. 70, no. 3, p. 318–329.
Phillips, C., 2014, Hydrocarbon characterization study Romney-1: Report GR4673 by Intertek Geotech prepared for Anadarko Petroleum, 147 p., accessed October 15, 2017, https://data.eat.nzpam.govt.nz.
Pratt, W. E., 1942, Oil in the Earth: Lawrence, Kansas, The University of Kansas Press, 103 p.
Rankey, E. C., and J. C. Mitchell, 2003, That’s why it’s called interpretation: Impact of horizon uncertainty on seismic attribute analysis: Leading Edge, v. 22, no. 9, p. 820–828, doi:10.1190/1.1614152.
Rose, P. R. 2001, Risk analysis and management of petroleum exploration ventures: AAPG Methods in Exploration Series 12, 164 p.
Rudolph, K. W., and F. J. Goulding, 2017, Benchmarking exploration predictions and performance using 20+ yr of drilling results: One company’s experience: AAPG Bulletin, v. 101, no. 2, p. 161–176, doi:10.1306/06281616060.
Syed, M., 2015, Black box thinking: Why most people never learn from their mistakes -but some do: New York, Portfolio/Penguin, 325 p.
Sykes, M. A., K. C. Hood, S. N. Salzman, and C. J. Vanderwater, 2011, “Say what we mean and mean what we say”: The unified risk model as a force for shared understanding (abs.): AAPG International Conference and Exhibition, Milan, Italy, October 23–26, 2011, http://www.searchanddiscovery.com/abstracts/html/2011/ice/abstracts/abstracts410.html.
Tari, G. C., and M. D. Simmons, 2018, History of deepwater exploration in the Black Sea and an overview of deepwater petroleum play types, in M. D. Simmons, G. C. Tari, and A. I. Okay, eds., Petroleum geology of the Black Sea: Geological Society, London, Special Publications 2018, v. 464, p. 439–475, doi:10.1144/SP464.16
ACKNOWLEDGMENTS
We thank John Kusiak and Kevin Dale for their comments on an earlier version of the decision tree. We are grateful to Stephen P. Cumella, Ian M. Longley, and Albino Quadrelli for their constructive reviews of the manuscript.