ABSTRACT
We interpret the sedimentologic evolution of a deep-water channel-levee deposit in Green Canyon Block 955 (deep-water Gulf of Mexico) by analyzing hydrate-bearing pressure cores and nonpressure cores collected during The University of Texas-Gulf of Mexico 2-1 (UT-GOM2-1) Hydrate Pressure Coring Expedition that preserve remarkable sedimentary structures. The levee is composed of alternating beds of sandy silt and clayey silt that range from millimeters to meters in thickness. We interpret that each couplet of sandy silt and clayey silt records a single turbidity current flow in which the upper part of the flow overtops the levee and is deposited along its flank. The sandy silt is coarser, its beds are thicker, and the fraction of sandy silt to clayey silt (net-to-gross) is greater near the base of the levee. We interpret that as the levee grew, the channel depth increased and a smaller fraction of the flow overtopped the levee. An increase in net-to-gross, both at the base and near the top of the cored section, may record an increase in the size of turbidity current flows or a decrease in the relative height of the levee. Based on the limited core recovery, we infer that the lithology of the bounding unit immediately above the hydrate-bearing unit is thinner bedded and has lower net-to-gross than the hydrate reservoir. The bounding unit below the hydrate-bearing interval is similarly thinner bedded, yet contains high saturations of hydrate. This study illuminates the lithologic architecture of leveed-channel turbidite reservoirs at core scale and provides insight into how lithology controls hydrate distribution and concentration.
INTRODUCTION
Deep-water channel-levee systems are conduits for the movement of massive amounts of sediment to the deep ocean (Covault and Graham, 2010). These depositional systems have been studied in outcrop (Gardner et al., 2003; Beaubouef, 2004; Figueiredo et al., 2010; Hodgson et al., 2011; Kane and Hodgson, 2011; L. Hansen et al., 2017a) and with seismic data (Deptuck et al., 2003; L. Hansen et al., 2017b) and coupled to cores and geophysical logs (Hackbarth and Shew, 1994; Enunwa et al., 2005). Studies of near-seafloor channel-levee systems show these systems evolve from an initial period of incision to levee growth and vertical aggradation (Deptuck et al., 2003; Sawyer et al., 2007; Hodgson et al., 2011).
The sedimentology of near-surface channel-levee systems has been the focus of numerous scientific research cruises. Integrated Ocean Drilling Program (IODP) Expedition 308 documented fine-grained, thin-bedded turbidites within the Brazos-Trinity slope system (Prather et al., 2012) and the eastern levee of Southwest Pass Canyon of the Gulf of Mexico (Sawyer et al., 2009). The Deep Sea Drilling Project Leg 96 documented muddy, thin-bedded turbidites within the levee of the Pleistocene Mississippi Fan (Pickering et al., 1986). Thick levees of the Einstein channel in Viosca Knoll, northern Gulf of Mexico, were found to be similarly fine-grained, with a net-to-gross and bed thickness that decrease upward to the top of the levees (Hackbarth and Shew, 1994). Ocean Drilling Program (ODP) Leg 155 found the levees of the recent Amazon channel to be composed of alternating mud and silt laminae (Hiscott et al., 1997; Piper and Deptuck, 1997).
The levee deposits are a substantial volumetric element of channel-levee systems. They are formed by the overspilling of turbidity currents (Walker, 1978; Piper and Normark, 2001; Beaubouef, 2004; Sawyer et al., 2007; Morris et al., 2014; L. A. S. Hansen et al., 2015). While often finer-grained and with less porosity and permeability than channel fill (Cronin et al., 2000), the lithology of deep-water levees is commonly coarse enough to contain substantial porosity and permeability (Browne and Slatt, 1997). As such, levees are important reservoirs of productive conventional petroleum systems (Kendrick, 2000). Within the Gulf of Mexico, petroleum has been produced from fine-grained interbedded sand and mud levees at the Ram-Powell (Clemenceau, 1995; Clemenceau et al., 2000), Magnolia (Weissenburger and Borbas, 2004; McCarthy et al., 2005; Jobe, 2010; Jobe et al., 2012; Kane et al., 2012), and Tahoe (Kendrick, 2000; Enunwa et al., 2005) fields.
Deep-water channel-levee systems are also reservoirs for methane hydrate, an ice-like crystalline solid that consists of methane locked inside a cage structure of water molecules (Sloan, 2003). Methane hydrate is found at low temperatures and high pressures in the presence of methane gas and water. Deposits of methane hydrate are ubiquitous in the slope environment of most continental margins (Kvenvolden, 1988); however, the most favorable occurrence types for potential energy extraction are those that occur as high-saturation pore-fill within sand and silt-rich sediments (Boswell et al., 2014). Therefore, the study of potentially productive marine hydrate reservoirs has focused on near-surface channel-levee systems and the associated turbidite sands of the deep water. Recent studies of turbidite-hosted marine hydrate have occurred in the Krishna-Godavari Basin (Boswell et al., 2019; Oshima et al., 2019; Shukla et al., 2019), the Ulleung Basin (Ryu et al., 2013), the Nankai Trough (Fujii et al., 2008; Noguchi et al., 2011; Ito et al., 2015, 2018), and the Gulf of Mexico (Boswell et al., 2012b; Frye et al., 2012; Collett et al., 2014).
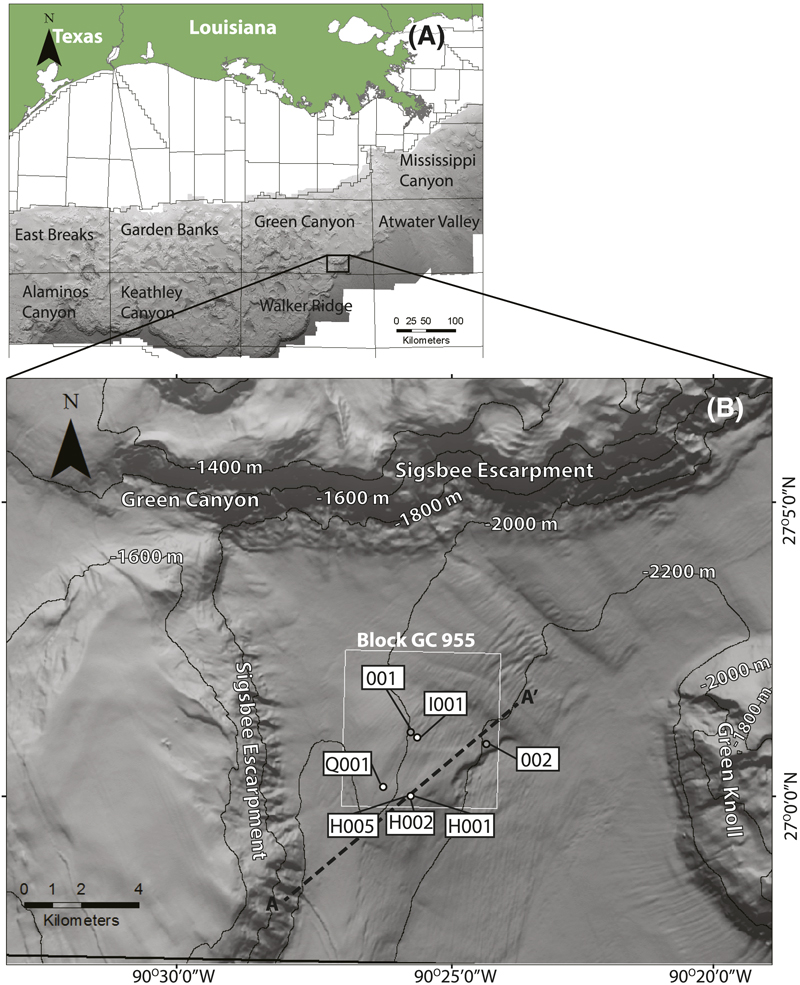 Figure 1. (A) The study area (black box) is within Block 955 of the Green Canyon (GC 955) protraction area at the base of the Sigsbee Escarpment. (B) Bathymetric map of the study area, showing the location of industry wells (001 and 002), Joint Industry Project II holes (H001, I001, and Q001), and the two The University of Texas-Gulf of Mexico 2-1 (UT-GOM2-1) Hydrate Pressure Coring Expedition holes (H002, H005). The black dashed line is the location of seismic section AA′ (Figure 2). Contour lines are in meters below sea level.
The University of Texas-Gulf of Mexico 2-1 (UT-GOM2-1) Hydrate Pressure Coring Expedition was funded by the US Department of Energy Award DE-FE0023919 and advised by the US Geological Survey and the Bureau of Ocean Energy Management. As part of this program, two holes were drilled into the levee of a methane hydrate-bearing Pleistocene submarine channel in Green Canyon Block 955 (GC 955) in the deep-water Gulf of Mexico (Flemings et al., 2017). Pressure cores of the hydrate-bearing interval were recovered (Thomas et al., 2020, this issue), and we observed that the presence of hydrate strengthened the unlithified sediment, making it possible to image and study gas hydrate-bearing core that is commonly difficult to retrieve. We use physical measurements, grain size data, and x-ray mineralogic analysis of pressure cores and conventional, nonpressure cores to elucidate the depositional process responsible for the creation of the hydrate reservoir. This paper documents the sedimentology and lithostratigraphy of the hydrate-bearing interval of the channel-levee system at GC 955. The results of this study can be compared with seismic interpretation (Portnov et al., 2020, this issue; Santra et al., 2020, this issue), depressurization experiments (Phillips et al., 2020, this issue), and pressure-coring analyses (Flemings et al., 2020, this issue; Thomas et al., 2020, this issue) presented within this special volume.
GEOLOGIC SETTING AND PREVIOUS WORK
The GC 955 is immediately basinward of the Sigsbee Escarpment, at the mouth of the Green Canyon reentrant (Figure 1). The seafloor is at a depth of 1975–2250 m and gently dips to the southeast. The area is heavily affected by salt tectonics and diapirism (Portnov et al., 2018), which has created abundant faulting and a salt-cored anticline (Figure 2). The suprasalt section contains a major north-south–trending channel-levee system (Santra et al., 2020, this issue), which has been interpreted as a Pleistocene-aged sediment fairway related to the Mississippi Fan system by Weimer (1990).
Figure 2. (A) Seismic section AA′ across the study area (located in Figure 1). The original Joint Industry Project (JIP) II H001 hole (black) as well as the The University of Texas-Gulf of Mexico 2-1 (UT-GOM2-1) Hydrate Pressure Coring Expedition H002 (blue) and H005 (yellow) holes targeted the high-amplitude reflectors of the shallow subsurface directly above a salt anticline. These holes encountered hydrate within the early-stage channel (subunit 3-I) and finer-grained, water-bearing sediments within the late-stage channel (subunit 3-II). (B) Zoomed-in detail of well penetrations. The strong positive (black) over negative (white) was interpreted as hydrate-bearing sediments. Gamma-ray (green) and resistivity (red) curves are from the 2009 JIP II H001 hole. The high resistivity and low gamma ray are interpreted to record the presence of hydrocarbons within a coarse-grained reservoir.
The GC 955 channel-levee system was first described by McConnell (2000) in an analysis of shallow hazards in this region that used seismic reflection data. In 1999, drilling of the first industry well in GC 955 confirmed the presence of sand within the shallow subsurface (McConnell et al., 2010). Later evaluation led to the identification of gas chimneys and shallow gas deposits associated with the channel system (Meldahl et al., 2001; Heggland, 2004). Further geophysical analysis led to the identification of a strong positive reflector above the shallow gas (Figure 2, inset), which was interpreted to record the upper boundary of potential hydrate-bearing sediments (McConnell et al., 2010). Several locations associated with the channel levee system within GC 955 were identified as prospective hydrate targets (D. R. Hutchinson et al., 2008; D. Hutchinson, 2009; Ruppel et al., 2008), of which, three holes (I001, H001, and Q001) were drilled in 2009 as part of the Joint Industry Project (JIP) II (Boswell et al., 2012a, b; Collett and Boswell, 2012). Logging-while-drilling (LWD) data confirmed the presence of hydrate within coarse-grained reservoirs among all three holes (Guerin et al., 2010). No core was obtained during this drilling program.
The H001 hole intersected a zone of high resistivity and low gamma ray (Figure 3), which was interpreted as a hydrate-bearing channel levee deposit of fine to very-fine sand beds 0.15–1.2 m thick interbedded with clay beds 0.15–0.6 m thick (Boswell et al., 2012b). Low gamma-ray and resistivity readings may record the presence of water-bearing sands directly above and below the hydrate reservoir; however, these readings might also record borehole washout, which is recorded by high-caliper readings (Figure 3B). A similar lithologic succession was encountered at the nearby Q001 hole (Figure 1), but possible gas flow prevented completing the hole to depth (Boswell et al., 2012b).
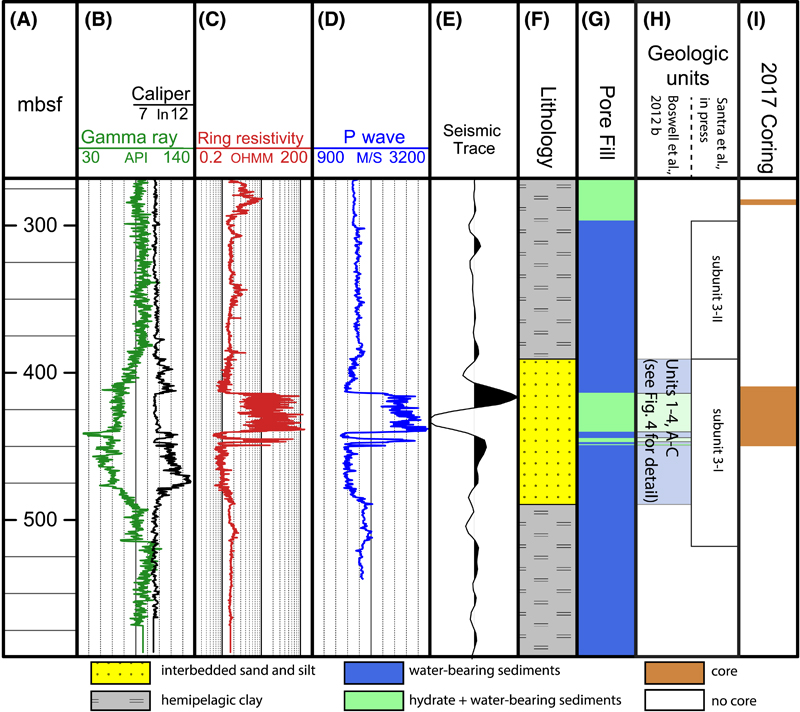 Figure 3. Logging-while-drilling (LWD) logs from the 2009 JIP Green Canyon Block 955 H001 hole (Guerin et al., 2010) that was twinned and pressure cored during the 2017 The University of Texas-Gulf of Mexico 2-1 (UT-GOM2-1) Hydrate Pressure Coring Expedition. The presence of hydrate within a clastic reservoir was inferred from the high-resistivity, high–sonic velocity, low–gamma ray interval from 414 to 450 meters below seafloor (mbsf). (A) Depth in mbsf. (B–D) The LWD logs from the 2009 Joint Industry Project expedition. (E) Seismic trace from the H001 location. (F) Lithology interpreted from LWD logs. (G) Pore fill. (H) Nomenclature of geologic units from Boswell et al. (2012b) on the left and Santra et al. (2020, this issue) on the right. For greater detail of unit 1 through unit 4, see Figure 4. (I) Intervals cored during the 2017 UT-GOM2-1 expedition. For greater detail of core recovery, see Figure 4.
Santra et al. (2020, this issue) used recently reprocessed three-dimensional (3-D) seismic data to interpret that the channel system is composed of two units: an early-stage bypass system with coarse-grained levees and no channel fill (subunit 3-I) and a later stage with fine-grained levees and coarse fill (subunit 3-II) (Figure 2). The levee reservoir of subunit 3-I is compartmentalized by gravitational failure surfaces (Santra et al., 2020, this issue). The overlying subunit 3-II (Figure 2) is largely composed of mud.
Through well-log and geophysical analysis, the early stage (subunit 3-I) of the channel-levee system at GC 955 has been interpreted as a hydrate reservoir with potential water-bearing zones immediately above and below (Boswell et al., 2012b). Because of the limited resolution of seismic and LWD data, the fine-scale lithologic composition and architecture of the hydrate-bearing interval and the nature of the bounding units above and below the main hydrate reservoir were unknown.
DATA AND METHODS
We use the naming convention from Boswell et al. (2012b) to identify the geologic units of the hydrate reservoir. The high-resistivity, high–P wave intervals (units A, B, and C in Figure 4) are interpreted as high saturations of hydrate in interbedded sand and mud. The low-resistivity, low P wave intervals (units 1, 2, 3, and 4 in Figure 4) are interpreted as water-bearing units that bound the hydrate reservoir.
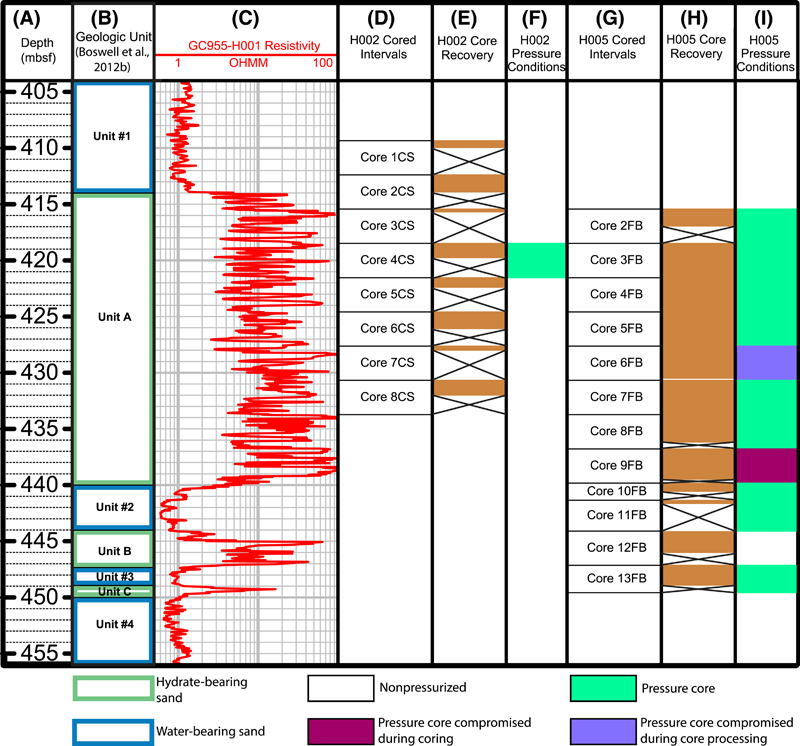 Figure 4. Core recovery during The University of Texas-Gulf of Mexico 2-1 (UT-GOM2-1) Hydrate Pressure Coring Expedition from holes H002 and H005. (A) Depth in meters below seafloor (mbsf). (B) Geologic units from Boswell et al. (2012b). (C) Ring resistivity from GC 955-H001. (D) H002 cored intervals. (E) Core recovery of H002. (F) Pressure conditions from core recovered from H002. (G) H005 cored intervals. (H) Core recovery of H005. (I) Pressure conditions from core recovered from H005. The H002 hole had low recovery, with only one core maintaining pressure (Thomas et al., 2020, this issue), whereas H005 had better recovery through the high-resistivity zone of unit A (cores 2FB-10FB), with low recovery in the upper and lower bounding units (core 1CS-1 in unit 1 and core 11FB in unit 2, respectively) (Thomas et al., 2020, this issue).
We compared the lithological interpretation from the 2009 JIP II LWD campaign at the H001 hole (Guerin et al., 2010) to laboratory analysis of core samples recovered from the two holes (GC 955 H002 and GC 955 H005) drilled in 2017 (Flemings et al., 2020, this issue). The core samples include (1) cores recovered under in situ pressure (pressure cores) and (2) attempted pressure cores that failed to seal and were recovered under pressure–temperature conditions in which hydrate is not stable (nonpressure cores). Pressure cores have been useful in the study of conventional petroleum systems (Hagedorn and Blackwell, 1972) as well as hydrate systems (Collett et al., 2008; Holland et al., 2008; Inada and Yamamoto, 2015; Gupta et al., 2018; Boswell et al., 2019; Holland et al., 2019). Resistivity, density, and x-ray data were acquired from physical measurements of the pressure cores, and two methods of grain-size analysis were conducted on sediments recovered from nonpressure cores and depressurized pressure cores. The methods, from predrill assessment to postexpedition core analysis, are described below.
![]() Figure 5. X-ray computed tomography of the three lithofacies (upper) and interpreted features (lower). (A) The structureless silty clay from 130 m above the hydrate reservoir (core H005-01FB, 26–35 cm). (B) The sandy silt (core H005-02FB, 65–74 cm) has abundant ripple lamination, with individual sets up to 3 cm thick. (C) The clayey silt has zones of dark, structureless sediment as well as regular, sub-millimeter scale planar lamination of lighter material (core H005-04FB, 96–105 cm).
Figure 5. X-ray computed tomography of the three lithofacies (upper) and interpreted features (lower). (A) The structureless silty clay from 130 m above the hydrate reservoir (core H005-01FB, 26–35 cm). (B) The sandy silt (core H005-02FB, 65–74 cm) has abundant ripple lamination, with individual sets up to 3 cm thick. (C) The clayey silt has zones of dark, structureless sediment as well as regular, sub-millimeter scale planar lamination of lighter material (core H005-04FB, 96–105 cm).
At GC 955, two holes were drilled within 15 m of the hole GC 955-H001 (Figure 2) in order to obtain pressure cores from the main hydrate reservoir of unit A (414–440 m below seafloor [mbsf] in Figure 4) as well as the contacts at the base and above the reservoir. Core recovery was low for the first hole but high in the second hole (H002 and H005, respectively, in Figure 4). Core recovery was highest within unit A (414–440 mbsf in Figure 4) and lower within the bounding units (unit 1 and unit 2 in Figure 4B). More information on the drilling and pressure-coring operations may be found in the initial report (Flemings et al., 2018), Thomas et al. (2020, this issue), and Flemings et al. (2020, this issue).
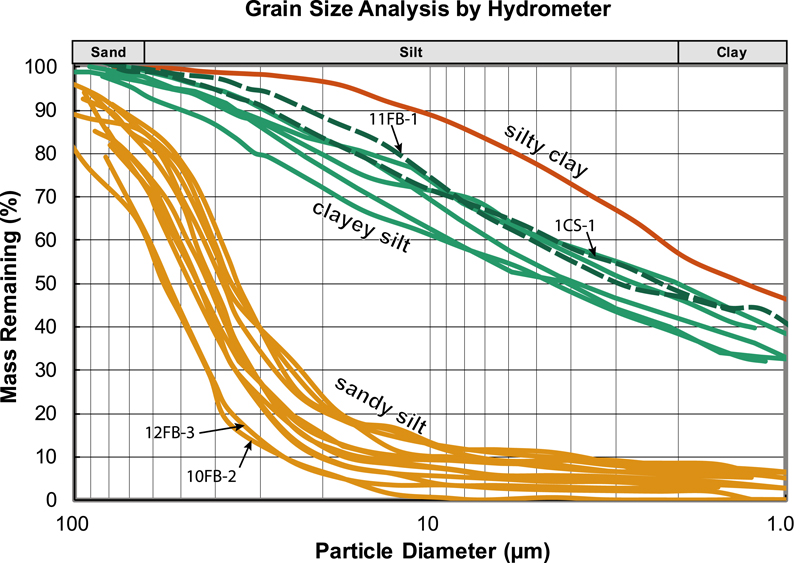 Figure 6. Particle size distribution for the three lithofacies based on hydrometer analysis. Grain size was classified based on a modified version of the Udden-Wentworth grain size scale (Wentworth, 1922), with cutoffs for clay at less than 2 μm and sand at greater than 63 μm. The steep angle of sandy silt from 90 to 20 μm indicates better sorting than the silty clay and clayey silt. The coarsest-grained samples (10FB-2 and 12FB-3) are from near the base of the drilled interval. The darker, dashed lines represent sediment samples from the bounding layers above (1CS-1) and below (11FB-1) unit A (Figure 4).
Upon recovery, nondestructive physical measurements of the pressure cores were made with the pressure core analysis and transfer system (PCATS) (Schultheiss et al., 2011). Analyses included P wave velocity measurement (every 0.5 cm), gamma density measurements, and two-dimensional (2-D)/3-D x-ray imaging. The P wave velocity was calculated from the pulse travel time measured by two 500-kHz acoustic transducers with a precision of ±1.5 m s−1 and accuracy of ±5 m s−1 (Schultheiss et al., 2011). Gamma attenuation was measured every 0.5 cm using gamma photons from a 137Cs source and then calibrated to density (Schultheiss et al., 2011). Linear 2-D x-ray images were collected at a resolution of 112 μm per pixel. The 3-D x-ray computed tomography (CT) data were collected at the same voxel resolution of 112 μm per side. Each core was scanned every 0.8°, totaling 400 images per core. These CT data were then used to construct 5-cm-thick slab images that were used for the identification and measurement of sedimentary structures. Beds were measured at 0.5-cm resolution. All x-ray images are positive, therefore the higher-attenuation, denser material appears darker than the lower-attenuation, less-dense material in images.
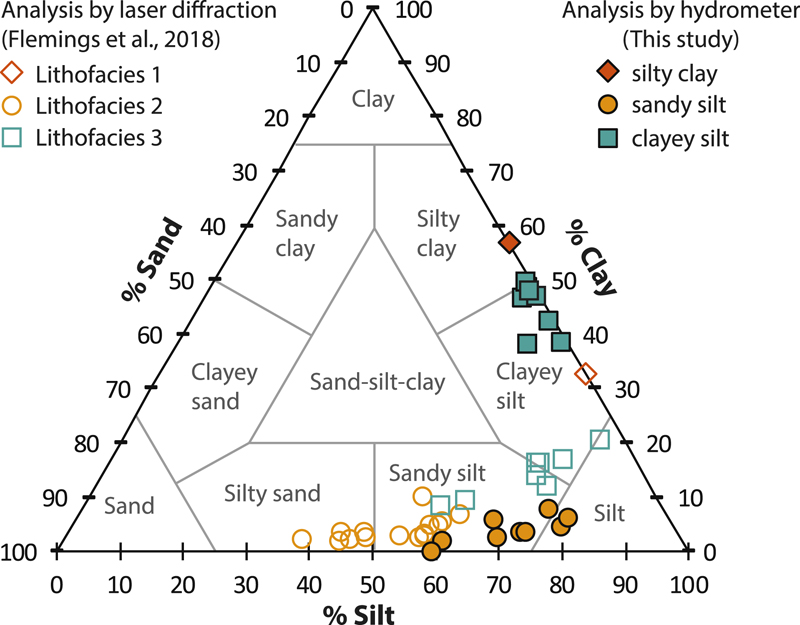 Figure 7. Sedimentological classification of the lithofacies based on the Shepard scale (Shepard, 1954). Grain size was classified based on a modified version of the Udden-Wentworth grain size scale (Wentworth, 1922), with cutoffs for clay at less than 2 μm and sand at greater than 63 μm. Analysis by hydrometer (closed symbols) shows that all samples from the main hydrate reservoir are composed of sandy silt and clayey silt, and one sample from the upper mud is silty clay. Analysis by laser diffraction (open symbols) (Flemings et al., 2018) produced substantially coarser results than those analyzed by the hydrometer method (closed symbols).
Following PCATS analyses, sections of the pressure core at least 10 cm in length were depressurized (Phillips et al., 2020, this issue). After depressurization, subsamples were collected for grain size experiments. Particle size distribution was analyzed using the hydrometer method following Germaine and Germaine (2009). The 35–70 g of homogenized sediment was thoroughly mixed with water and 5 g of a dispersing agent. At the end of the experiment, the sediment was poured through a 63-μm sieve to separate the sand fraction from the fines. Grain size was classified based on a modified version of the Udden-Wentworth grain-size scale (Wentworth, 1922), with cutoffs for clay at less than 2 μm and sand at greater than 63 μm. The grain size by hydrometer method was compared to the laser diffraction particle size analysis used to report on the grain size of cored sediments (Flemings et al., 2020, this issue). The Shepard nomenclature (Shepard, 1954) was used to classify and name each sample based on relative sand, silt, and clay content. Sorting was determined using the inclusive graphic standard deviation methodology of Folk (1980).
Sediments from nonpressure cores were examined visually and in smear slide under a petrographic microscope per IODP protocols (e.g., Tréhu et al., 2005). Small samples were collected by toothpick for microscopic description of the lithology. Smear slides were prepared on glass slides, dried on a hotplate, and cured under an ultraviolet light. Percentage estimates of the major lithologic and biogenic components were estimated and reported in the GOM-2-1 initial report (Flemings et al., 2018).
Mineralogical analysis of the whole rock and the clay fraction (<2-μm sized) was conducted by x-ray powder diffraction at the James Hutton Limited Analytical Laboratories. Quantitative analysis of mineral content was performed by a normalized full pattern reference intensity ratio method. Uncertainty is dependent on the relative concentration and is reported as ±x0.35, where x is the concentration in weight percent. Compositionally, sediment samples were classified based on the relative percentage of the clay fraction and mineralogy of the silt-to-sand fraction as described by Pettijohn et al. (2012).
RESULTS
Lithofacies Description
We defined lithofacies based on physical properties and named them based on the dominant grain size. This classification separates muds that are far above the hydrate reservoir (silty clay sample) from interbedded sandy silts (sandy silt) and silty muds (clayey silt) within the hydrate reservoir interval.

Silty Clay
One pressure core was collected from 130 m above the reservoir at 282 mbsf at the H005 location (Figure 2). It has a P wave velocity of approximately 1700 m/s, a density of 2.0 g/cm2 and a relatively high x-ray attenuation. In x-ray, this core appears mostly homogenous, with no sedimentary structures or signs of bioturbation (Figure 5A). Thin, near-vertical fractures of low-attenuation material are found throughout the core (Figure 5A). This core is interpreted to be composed of entirely the same lithologic unit. The one sample analyzed for particle size distribution has 57% clay-sized particles, 43% silt-sized particles, and negligible sand with median grain size (D 0.50) of 1.4 μm and sorting coefficient of 3.0 (Figure 6; Table 1). This lithofacies is defined as a poorly sorted silty clay (Figure 7).

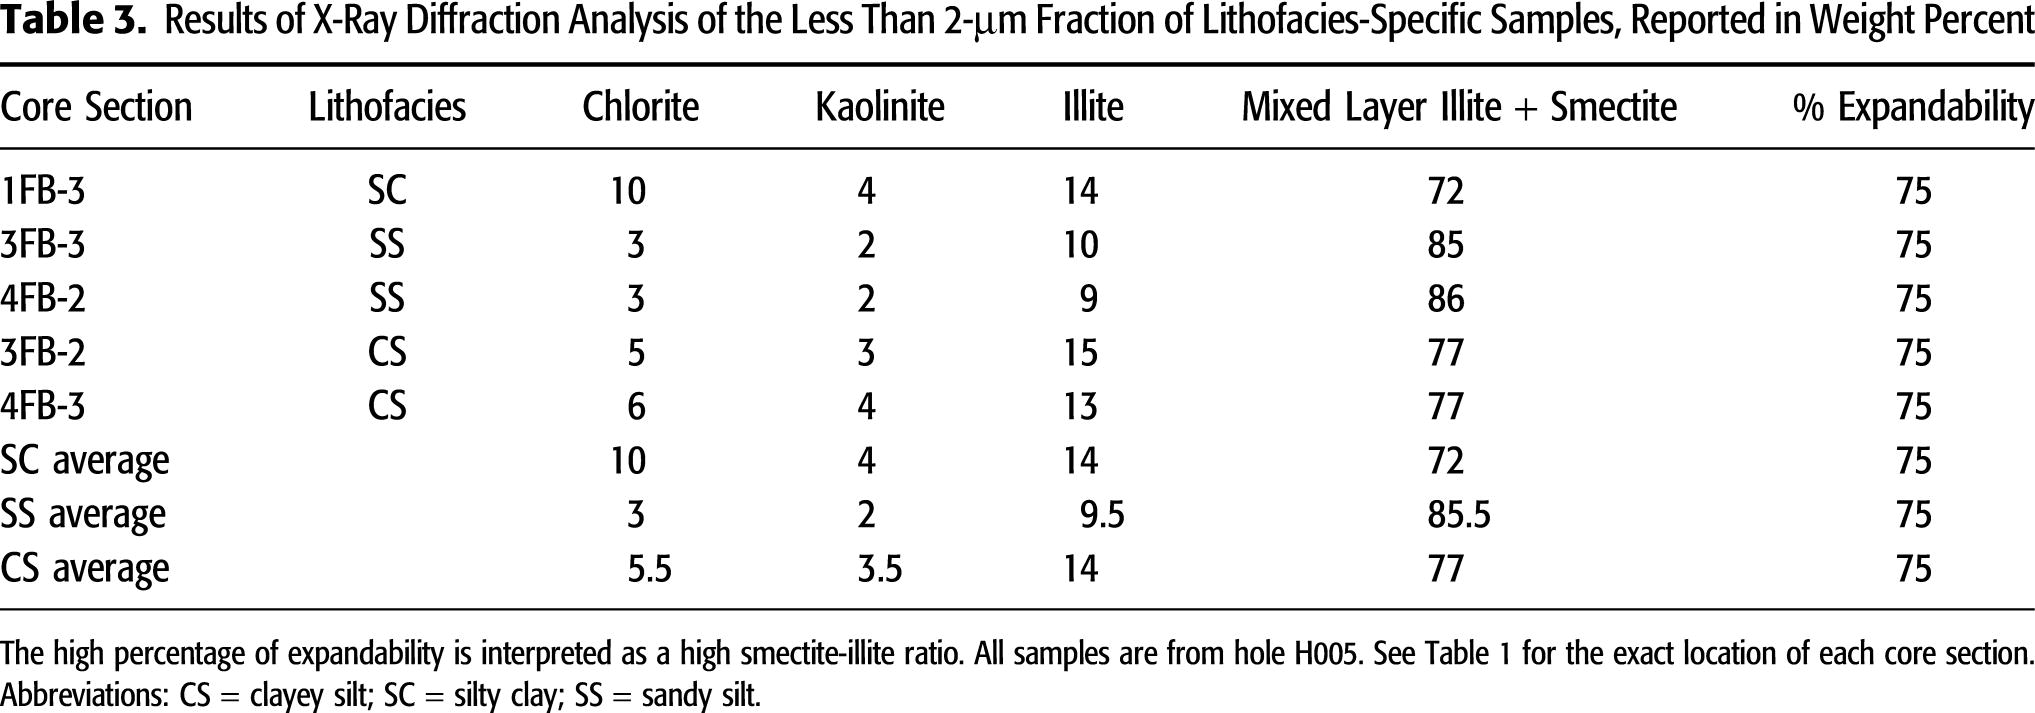
The bulk mineralogy of the silty clay is dominated by illite-smectite, quartz, and plagioclase, with accessory minerals including calcite, potassium feldspar, and dolomite (Table 2). Trace amounts of amphibole, siderite, pyrite, halite, and kaolinite are also present. The clay fraction (<2 μm) is composed of 72% interlayered illite and smectite, 14% illite, 10% chlorite, and 4% kaolinite (Table 3).
Interbedded Sandy Silt and Clayey Silt
X-ray scans of pressure cores from the hydrate reservoir reveal two interbedded lithologies: a lighter-colored, less-attenuated lithofacies and a darker-colored, more-attenuated lithofacies (Figure 8). The median grain size (D 0.50) for the lighter-colored, less-attenuated lithofacies is 35–55 μm (Figure 6). Although two of the samples lie in the silt regime, most of the samples are sandy silts (Figure 7); therefore, we have termed this lithofacies as “sandy silt.” The sandy silt lithofacies has a P wave velocity of 2500–3500 m/s, a density of 1.85–1.95 g/cm2, and low x-ray attenuation (Figure 8). Ripple cross-lamination sets with relief up to 3 cm are abundant (Figure 9A, [264–267 cm]; Figure 5B). In the failed pressure cores, the sandy silt is darker in shallower cores (1CS-1 and 2CS-2 in Figure 10) and lighter in deeper cores (8CS-4 in Figure 10); the deeper cores contain more sand than the shallower cores. Bubbles are sometimes found in sandy silt in the failed pressure cores (e.g., 35–45 cm in 2CS-2 in Figure 10). The sandy silt is well-sorted with almost 90% of the mass fraction lying between 20 and 100 μm (Figure 6).
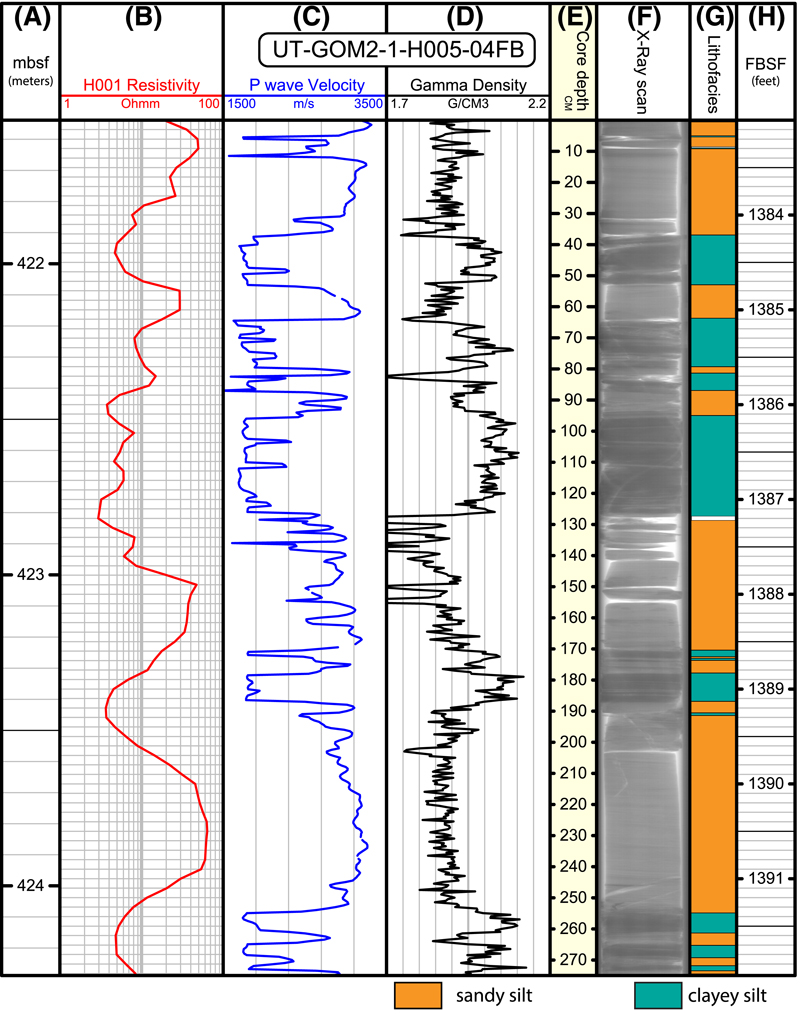 Figure 8. Comparison of resistivity from the 2009 Joint Industry Project II expedition (Guerin et al., 2010) to pressure core analysis and transfer system analysis of the top 275 cm of pressure core H005 4FB (total length 315 cm). (A) Depth in meters below seafloor (mbsf). (B) Ring resistivity from the logging-while-drilling log at the H001 hole (Guerin et al., 2010). (C) P wave compressional velocity from pressure core analysis of H005 4FB. (D) Gamma density from pressure core analysis of H005 4FB. (E) Core depth of H005 4FB. (F) Pressure core x-ray scan of core H005 4FB. (G) Distribution of lithofacies within core 4FB. The sandy silt has a lower density, higher P wave velocity, and lower x-ray attenuation (lighter color). The clayey silt has a higher density, lower P wave velocity, and a higher x-ray attenuation (darker color). (H) Depth in feet below seafloor (FBSF).
The sandy silt lithofacies is composed of primarily quartz and plagioclase, with accessory minerals including potassium feldspar, dolomite, illite-smectite, and calcite (Table 2). Trace amounts of amphibole, siderite, and halite are also present. In smear slides, most grains are angular and composed of quartz, detrital carbonate, and feldspar (Figure 11A). The clay fraction (<2 μm) from x-ray diffraction is composed of mostly smectite with minor amounts of illite, chlorite, and kaolinite (Table 3). The sandy silt lithofacies is classified as a lithic arkose.
The darker-colored, higher-attenuated interbedded lithofacies (Figure 8) is classified as a clayey silt (Figure 7) with less than 10% sand-sized particles and 40%–50% clay-sized particles (Figure 6; Table 1). It has a lower P wave velocity (1600–2400 m/s), higher density (2.0–2.1 g/cm2), and higher x-ray attenuation than the sandy silt (Figure 8). The median grain size (D 0.50) for the clayey silt lithofacies is 2.0–4.6 μm. This lithofacies is more poorly sorted than the silty clay or sandy silt lithofacies, with an average sorting coefficient of 3.3 (Table 1).
 Figure 9. (A–C) The results of pressure core analysis and transfer system analysis of selected pressure core intervals, displaying exquisite sedimentary features and the thin, interbedded nature of the sandy silt and clayey silt interbedded at the sub-centimeter scale. The upward transition from sandy silt to clayey silt is often gradational, whereas the upward contact from the clayey silt to the sandy silt is sharp. CT = computed tomography; mbsf = meters below seafloor.
The clayey silt is dominated by quartz, plagioclase, and interlayered illite-smectite (Table 2). Accessory minerals, including calcite, potassium feldspar, and dolomite, are also present. Trace amounts of chlorite, amphibole, siderite, pyrite, halite, and kaolinite are also present. In smear slides, the mineralogy of this lithofacies is similar to that of the sandy silt lithofacies, with rare biogenic grains present (Figure 10B). X-ray diffraction results show that the clay fraction is composed of mostly smectite with interlayered illite and less than 10% chlorite and kaolinite (Table 3). The clayey silt lithofacies is classified as a lithic wacke.
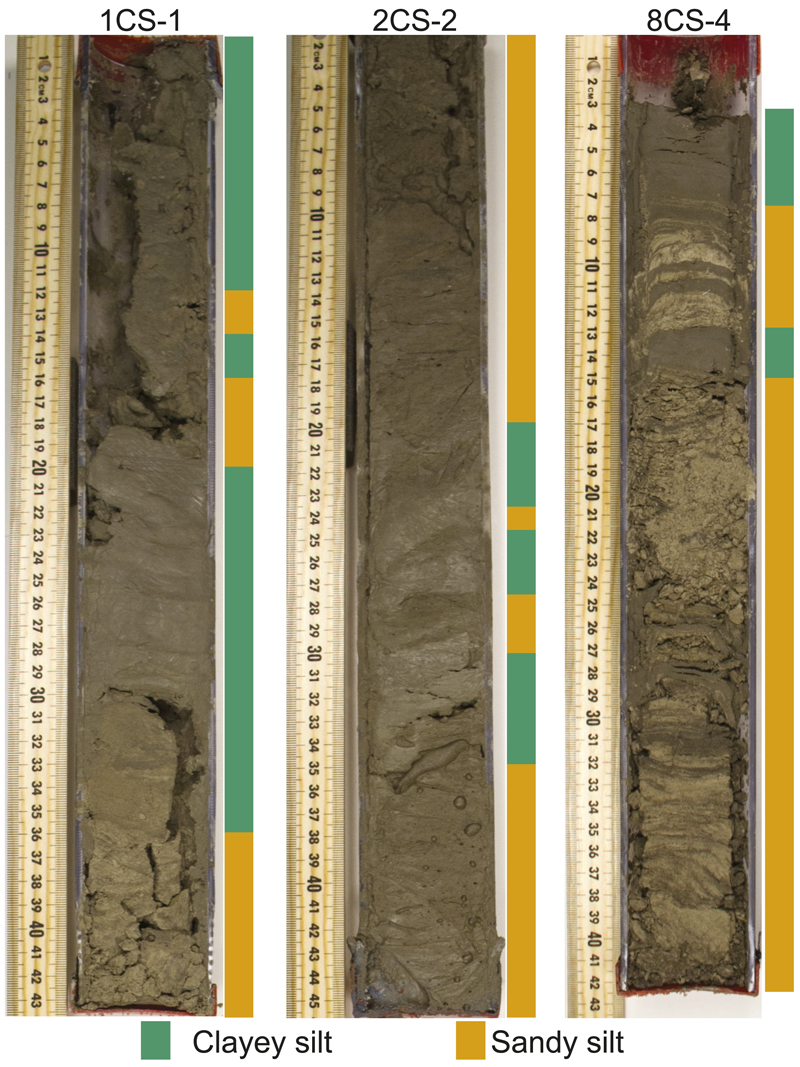 Figure 10. Photographs of split, nonpressure cores from H002: 1CS-1 is from unit 1, immediately above the hydrate reservoir (Figure 4); 2CS-2 spans the boundary of unit 1 and unit A; and 8CS-4 is from unit A.
The clayey silt generally appears structureless in nonpressure cores (Figure 10). However, in x-ray CT scans, laminae are observed in some locations, composed of alternating light (low-density) and dark (high-density) layers (Figure 5C). The layered interval is commonly less than 1 cm thick, with laminae a few millimeters thick that often thin upward (Figure 5C). The low-attenuation (low-density) layers may be composed of coarser material with higher hydrate saturation that are analogous to sediments of the sandy silt lithofacies. Three samples of the clayey silt that did not have the laminae were analyzed for particle size (see 8CS-4 3–6 cm, 11FB-1, and 12FB-1 in Table 1). All samples of the clayey silt lithofacies contain less clay than the silty clay (Figure 6).
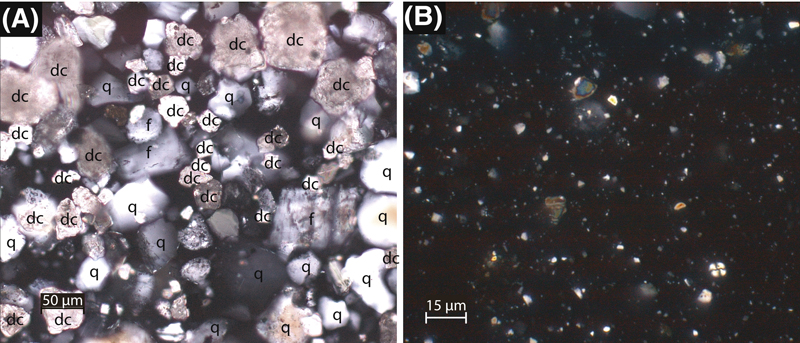 Figure 11. Photomicrographs of representative lithologic units from H002, core 2CS. (A) The sandy silt is composed of angular quartz (q), detrital carbonate (dc), and feldspar (f). (B) The clayey silt contains a composition similar to the sandy silt but at much smaller grain sizes and with minor amounts of biogenic grains.
The upward transition from the sandy silt lithofacies to the clayey silt lithofacies is sometimes gradual (Figure 9A, 261–265 cm) and other times sharp (Figure 9B, 101 cm). In contrast, the upward transition from the clayey silt lithofacies to the sandy silt lithofacies is most often sharp (Figure 9A [282 cm], B [94 cm, 105 cm], C [121 cm]). Thin planar laminae of lower-density (light) layers interbedded with higher-density (darker) material and corresponding intermediate P wave velocities are sometimes found where the contact is gradual (Figure 9A [261–263 cm, 278–282 cm], C [112–116 cm]).
Lithofacies Interpretation
Silty Clay
The silty clay lithofacies is interpreted to be a mud formed by hemipelagic sedimentation or very distal turbidity currents. The lack of sedimentary structures and the small grain size indicate that the silty clay was deposited in a very low–energy system. It is homogenous and has a clay mass fraction of approximately 60% dominated by interlayered smectite and illite. Its composition is similar to other shallow muds encountered on the Gulf of Mexico slope (e.g., Sawyer et al., 2009, site 1322), which are interpreted to record distal deposition relative to a submarine channel. Thin, vertical fractures of low-attenuation material found throughout the x-ray images (Figure 5A) are interpreted to be hydrate-filled fractures (Flemings et al., 2018).
Sandy Silt and Clayey Silt
We interpret that the sandy silt and clayey silt were sourced by an overspilling turbidity current that flowed down the channel axis and deposited sediment on the levees. The turbidity current was stratified, with a higher concentration of coarser material near the base and only finer material near the top. The head of the turbidity current was large enough to suspend clay, silt, and fine sand well above the height of the levee (Figure 12). The thickness of the spillover flow was much less than the thickness of the flow within the channel, resulting in a sudden decrease in the height and energy of the turbidity current away from the channel. Initial overspilling flow energy was high enough to transport fine silt and sand as bed load, forming ripples and cross-bedding in the sandy silt (Figure 5B). Stacked patterns of ripple lamination that we observe in our cores reach up to approximately 90 cm, indicating rapid sediment fallout from sustained flows (see Jobe et al., 2012). Thin clay drapes may show that the flows, although persistent, had repeated periods of localized low energy. Thin planar laminae within the sandy silt may record increased flow (upper plane bed) or decreased flow (lower plane bed), suggesting waxing and waning of individual flows. Such deposits are commonly found in the submarine channel-levee environment (Kane and Hodgson, 2011; Jobe et al., 2012; L. Hansen et al., 2017a).
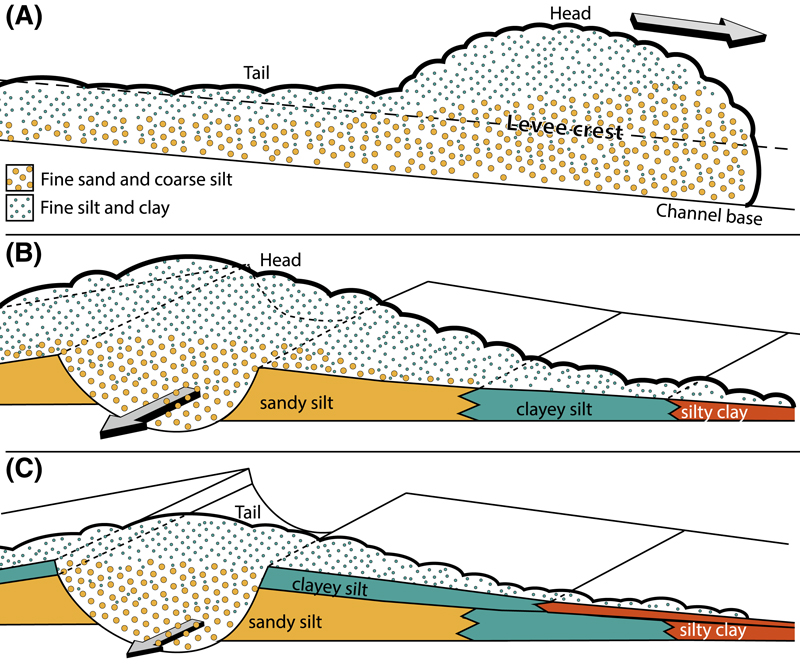 Figure 12. Depositional model for turbidite channel levee at Green Canyon Block 955. (A) Longitudinal view of stratified turbidity current. (B) The sandy silt is deposited on the levees proximal to the channel as the head of the bypassing turbidity current spills over the levees. The finer-grained clayey silt and silty clay are deposited more distally. (C) After the head passes, the tail of the turbidity current deposits clayey silt proximally and silty clay distally.
In pressure cores, the sandy silt is always found with high sonic velocities and low densities (Figure 9), which are interpreted as pore-filing hydrate with a high saturation. The presence of bubbles in nonpressure cores supports the interpretation of pore-filing hydrate within the sandy silt. Phillips et al. (2020, this issue) describe how hydrate saturations in the sandy silt range from 79% to 93%. The presence of gas hydrate in the pore spaces increases the bulk modulus and holds the unlithified sediment together, thereby increasing the measured compressional P wave velocity (Chand et al., 2004; Winters et al., 2007). The high-density and moderately low-sonic velocity readings of the clayey silt (Figure 9) are interpreted to record mud with a low to negligible amount of hydrate, which was confirmed by subsequent depressurization experiments (Phillips et al., 2020, this issue).
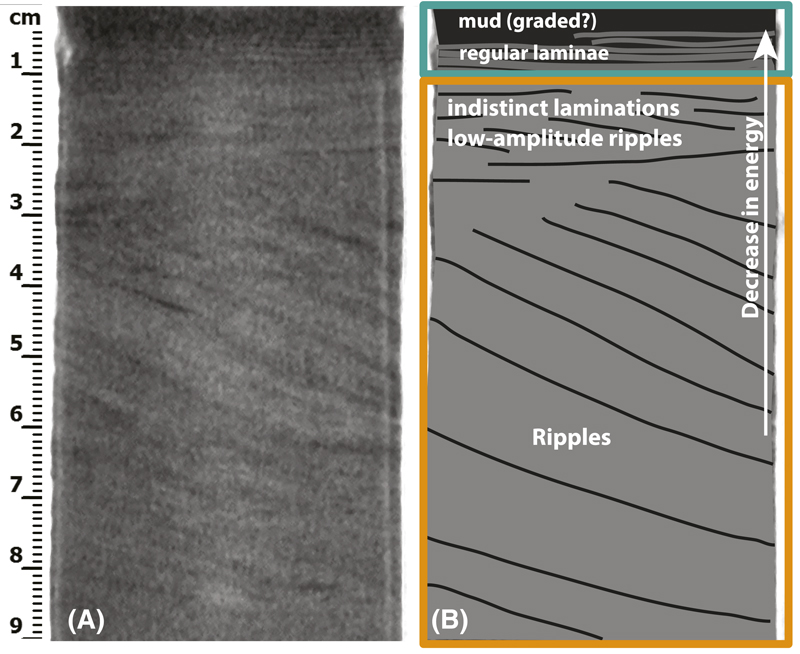 Figure 13. A complete stratigraphic succession resulting from a single, waning turbidity current, as described by Figure 11. (A) X-ray computed tomography scan of H005-7FB. (B) Interpretation of sedimentary structures of sandy silt (orange box) that grades into clayey silt (green box).
The clay mineral compositions in the sandy silt and the clayey silt (Table 3) are virtually indistinguishable. Additionally, a gradual transition is often present between the sandy silt and the clayey silt (e.g., Figure 9A [255–282 cm], C [105–120 cm]). Therefore, we interpret that the two lithologic units are related and originated from the deposition of sediment gravity flows at differing energy conditions. One possible mechanism is that the succession of the sandy silt to clayey silt describes a single turbidity current in the main channel (Figure 12). The sandy silt is deposited near the levee crest when the head of the turbidity current, which had higher energy and more suspended coarser sediments higher in the section, spills over the levee. After the head passes, the lower-energy tail of the flow supplied the finer-grained sediments present in the clayey silt. The steady decrease in energy of a single turbidity current results in a deposit of rippled sandy silt that grades into laminations of fine silt and clay and ultimately clayey silt (Figure 13). The thin interbedded silts present in the clayey silt may represent shear sorting of silt and mud as flow from a waning turbidity current (Stow and Bowen, 1978, 1980). Alternatively, the finer-grained beds (clayey silt) may have been deposited by smaller or lower-energy turbidity currents compared to those responsible for the deposition of the coarser-grained beds (sandy silt).
DISCUSSION
Evolution of the Levee
Based on the recovered intact core, there are 163 beds of sandy silt that comprise 72% (17.04 m) of the total thickness. In turn, there are 148 beds of clayey silt that comprise 28% (6.51 m) of the total section. We define the net-to-gross value as the ratio of the thickness of sandy silt to the sum of the thicknesses of the sandy silt and clayey silt. Thus, the total net-to-gross is 72%.
Within any particular pressure core, the net-to-gross varies (Figure 9). At the base of the deepest cored section, the net-to-gross is 73%–75% within the section spanning unit B, unit 3, and unit C (445–450 mbsf in Figure 14). Net-to-gross is highest (97%) and both average and maximum thickness of sandy silt is greatest at the base of unit A (Figure 14F–H). Within unit A, net-to-gross declines upward to 59% (FB 4, 422–425 mbsf in Figure 14). The average bed thickness also decreases upward in this interval, from 19.0 cm at the base of unit A to 5.7 cm in core FB 5. The maximum thickness of the sandy silt follows a similar pattern, decreasing from 95.6 cm at the base of unit A to 26 cm in core FB 5 (Figure 14H). Above 422 m, the net-to-gross and the sandy silt bed thickness sharply increase once again, reaching values of 82% net-to-gross and 12.0-cm average thickness at the top of unit A before decreasing to 48% net-to-gross and 6.3-cm average thickness in unit 1 (Figure 14F–H). The net-to-gross follows similar patterns to those seen in the 2009 LWD data (Guerin et al., 2010), and interestingly, the highest peaks in resistivity correspond with the highest net-to-gross (416, 428.5, and 439 mbsf in Figure 14D, F). The P wave and resistivity values are high at the base of unit A and decrease upward to approximately 425 mbsf. Above this, the resistivity values increase once again to 416 mbsf and then decrease to the top of unit A. Over the same interval, gamma-ray values increase from 52 API at the base of unit A to 58 API at 422 mbsf and then decrease to 45 API at 416 mbsf. Overall, these trends show an overall decrease of hydrate-bearing coarse-grained sediments over unit A.
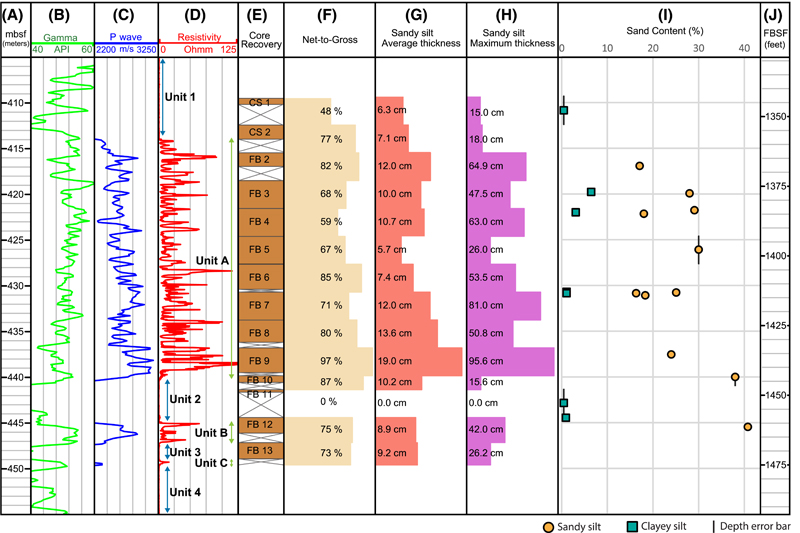 Figure 14. Synthesis of logging-while-drilling (LWD), stratigraphic, and sedimentologic data. (A) Depth in meters below seafloor (mbsf). (B) LWD gamma-ray log from H001. (C) LWD compressional velocity log from H001 hole. (D) LWD ring resistivity from H001 hole plotted on linear scale (Guerin et al., 2010) and geological units from Boswell et al. (2012b). (E) Core recovery from H002 (CS 1 and CS 2) and H005 (FB 2–FB 13). (F) Net-to-gross per core from H002 (CS 1 and CS 2) and H005 (FB 2–FB 13). (G) Average bed thickness of sandy silt per core from H002 (CS 1 and CS 2) and H005 (FB 2–FB 13). (H) Maximum thickness of any bed of sandy silt per core from H002 (CS 1 and CS 2) and H005 (FB 2–FB 13). (I) Percentage of sand from grain size measurements of H002 and H005 samples (Table 1). Orange dots are samples of sandy silt, and green squares are samples of clayey silt. Vertical black lines show the estimated depth of samples where the exact position is not precisely known. (J) Depth in feet below seafloor (FBSF).
The upward decrease in net-to-gross, average sandy silt bed thickness, and maximum bed thickness of the sandy silt is interpreted to record the progressive building of the levee by turbidity currents (Figure 15). Turbidity currents are stratified, with sediment concentration and coarse sediment fraction decreasing upward (Peakall et al., 2000; Straub et al., 2011; L. A. S. Hansen et al., 2015). Initially, the levees are small and the channel relief (R), as measured from the base of the channel to the top of the levee is low (Figure 15A). As each sequential turbidity current overspills the levee, sediment is deposited and the levee grows, increasing R. As the levee grows in height and R is increased, subsequent turbidity currents are increasingly confined and spill progressively less-coarse sediment over the levees (Figure 15B). This results in the gradual fining-upward pattern and upward decrease of sand deposited on the levee, similar to the patterns of Figure 14 described above. This succession is characteristic of other such channel-levee systems (Walker, 1978; Piper and Normark, 2001; Beaubouef, 2004; Straub and Mohrig, 2008).
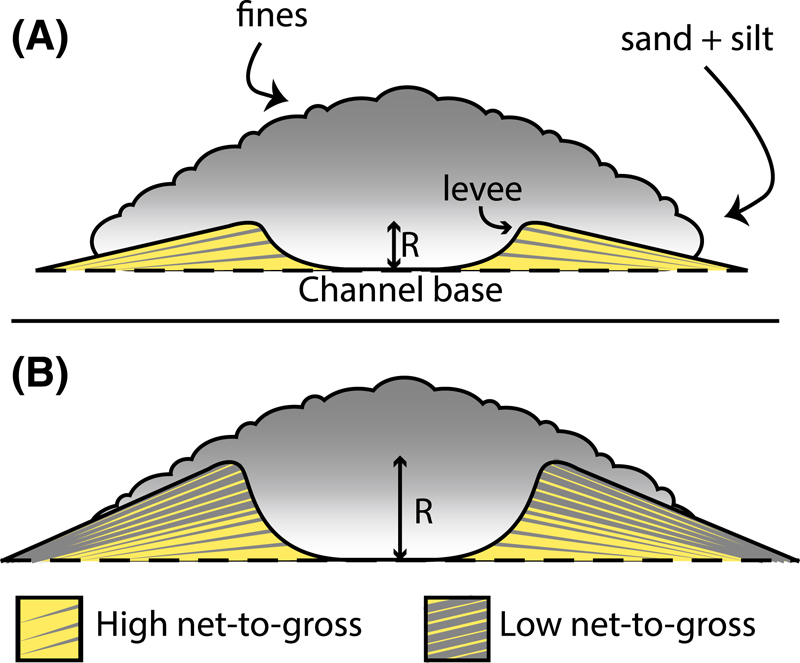 Figure 15. Cartoon evolution of the channel at Green Canyon Block 955. Flow of the turbidity current is into or out of the page for all images. (A) Early in the channel evolution, the vertical relief between the channel base and the top of the levees (R) was low, and the lower, sand-rich part of the turbidity current spilled over the levee and deposited coarse-grained sediments. (B) As the levees grew, the vertical relief between the channel base and the top of the levees increased. The turbidity currents were increasingly confined, and less coarse-grained material was deposited on the levees, leading to an upward decrease in net-to-gross.
The upward sharp increase in the average bed thickness of the sandy silt between cores 4FB and 5FB (Figure 14) record a possible increase in the intensity of the turbidity currents feeding the system. Alternatively, this transition records a relative decrease of the levee height. Such an abrupt change in net-to-gross and sandy silt bed thickness may be the result of levee collapse, as described by Santra et al. (2020, this issue), whereby oversteepening of the levee causes gravitational failure, and the internal levee slides toward the channel axis. As a result, R is reduced, the turbidity currents are less confined, and there is more overspill of coarse-grained sediments, leading to another episode of progressive thinning of turbidite deposits. Postcollapse, the levee begins to build again with subsequent overspilling turbidity currents.
The basal part of the cored section (unit 2, unit B, and unit 3) is thinner bedded. However, this is not the base of the entire levee (subunit 3-I), and this section may be composed of smaller or lower-energy turbidity currents. Alternatively, the fine-bedded character may represent overspill when the vertical relief of the levee was high, before a phase of gravitational failure as discussed by Santra et al. (2020, this issue).
Core-Log Comparison
The 2009 LWD resistivity data from GC 955 H001 and the 2017 pressure core data from H005 record very similar lithologies although they were drilled 15 m apart and have very different resolutions (Figure 8). The vertical resolution of the LWD ring resistivity is 5–8 cm (Lee and Collett, 2012). These data appear to accurately record the core properties when the individual bed thicknesses are greater than 20 cm. However, when the beds are thinner than 20 cm, the resistivity values are clearly averaging the different lithologies present at the boundary. The fact that individual beds are present within both H001 and H005 suggests that the beds as thin as 10 cm are laterally continuous for at least 15 m.
Grain Size Comparison
Flemings et al. (2018) provided the initial measurements of grain size as measured by laser diffraction. In this study, we conducted grain size analysis via the hydrometer method on subsamples from the same cores and found the fine-silt and clay fraction to be greater than the results provided by the laser diffraction method for each lithofacies (Figure 7). Such discrepancies are common (Wen et al., 2002; Ferro and Mirabile, 2009; Di Stefano et al., 2010), and we attribute this difference to variations in the shape and density of individual mineral clasts. The silty clay and clayey silt show the largest difference between methods, most likely because of the high fraction of nonspherical clay particles. The sandy silt is less affected but is still observed to be finer when measured via hydrometer versus the laser hydrometer method (Figure 7).
Clayey Silt versus Silty Clay
The clayey silt is composed of both clayey silt and thin laminae of coarser-grained material (Figure 5), whereas the silty clay contains only clay and silt. A notable difference exists in particle size between the silty clay and the clayey silt (Figure 6). One interpretation is that the difference in particle size between the silty clay and the clayey silt is solely because of the inclusion of coarse laminae in the clayey silt (Figure 5) and that the mudrock in the two lithofacies is identical. However, we sampled just the mud part in the clayey silt (see 8CS-4 3–6 cm, 11FB-1, and 12FB-1 in Table 1) and found it also to be coarser-grained than the silty clay. We interpret that they are distinct lithologies and that the slightly coarser-grained clayey silt is deposited more proximally to the levee channel than the finer-grained silty clay (Figure 11).
The Bounding Units of the Hydrate Reservoir
We have wondered since the 2009 LWD what distinguishes the nonhydrate-bearing units (units 1, 2, and 3 in Figure 4) from the hydrate-bearing reservoir units (units A, B, and C in Figure 4). Boswell et al. (2012b) suggested two possible interpretations. Based on the low gamma-ray values, the first interpretation is that the bounding units are water-bearing sands with less mud than the hydrate reservoir. The second interpretation is that the bounding units are finer grained, with a reduced permeability and increased capillary entry pressure that inhibited hydrate formation.
To test these hypotheses, we analyzed the particle size distribution at one location from unit 1 above the hydrate reservoir and one location from unit 2 below the reservoir (Figure 13; samples 1CS-01 and 11FB-1 in Table 1). These samples were clayey silt (dashed lines in Figure 6) with <2% sand content (Figure 13); however, these single samples may not be indicative of the overall lithology of the unit. When we cored these intervals, the recovery was low, and the ball valve did not seal within unit 1 (Thomas et al., 2020, this issue); we interpret that this was because much of the sediment was washed out during drilling. Of the sediment recovered, thin beds of sandy silt averaging 6.3–7.1 cm were found in nonpressure cores CS 1 from unit 1 and CS 2 (Figure 10). When compared to unit A, the net-to-gross and sandy silt bed thickness of unit 1 is low (Figure 14). We interpret that the low net-to-gross and thin-bedded architecture of unit 1 created difficulties in drilling that led to washout and poor log response within this unit.
The majority of core FB 13 is from unit 3 (Figure 14), which was originally interpreted as water-bearing with no hydrate based on LWD logs (Boswell et al., 2012b). Therefore, we expected this core to contain inappreciable amounts of hydrate. However, within the PCATS analysis of FB 13, we found numerous beds of sandy silt with low-density, high–P wave, and low-attenuation lithofacies, interpreted as hydrate (Figure 16). Lithologically, unit 3 is similar to unit 1, with thinner silty sand beds and a lower net-to-gross than that of unit A. It is possible that the low net-to-gross and thin-bedded character of unit 3 was difficult to drill during the original 2009 expedition, resulting in washout and poor log quality that affected the initial interpretation. It is therefore possible that all of the “water-bearing units” are in fact composed of thin-bedded, hydrate-bearing, low net-to-gross sandy silt interbedded with clayey silt.
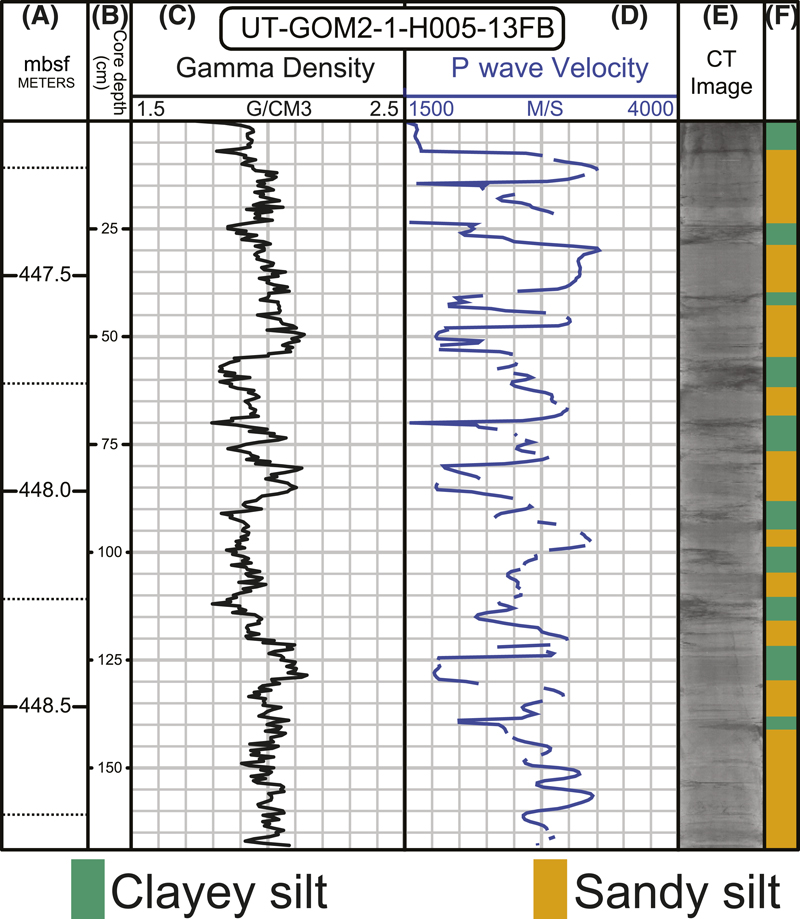 Figure 16. Pressure core analysis and transfer system analysis of core H005 13FB from unit 3. (A) Hole depth in meters below seafloor (mbsf). (B) Core depth in centimeters. (C) Gamma density. (D) The compressional P wave velocity is elevated within the sandy silt, interpreted as high concentrations of pore-filling hydrate. (E) X-ray computed tomography (CT) image of the core. (F) Interbedded lithofacies averaging 9.2 cm per sandy silt bed. UT-GOM2-1 = The University of Texas-Gulf of Mexico 2-1.
Alternatively, it is also possible that the stratigraphy is not consistent between the H001, H002, and H005 holes. However, this idea is contradicted by the correlation of hydrate-bearing layers between H001 and H005 (Figure 8) and H002 and H005 (Thomas et al., 2020, this issue). Another explanation may be that hydrate saturation is patchy throughout the reservoir for other reasons, as observed recently in the Nankai Trough, where individual beds were correlated between holes, but hydrate saturation varied (Tamaki et al., 2017).
CONCLUSIONS
We described the sedimentology and stratigraphy of an unlithified deep-water channel-levee hydrocarbon reservoir at the grain-to-bed scale and provided a depositional model for the system. The hydrate reservoir at GC 955 is composed of interbedded sandy silt and clayey silt. As observed from pressure cores, the sandy silt intervals always contain high P wave values interpreted as gas hydrate in high concentrations. Net-to-gross is greatest near the base of the cored interval and decreases upward, supporting the interpretation of LWD data from the 2009 JIP II campaign. We have described a simple depositional model to explain the interbedded stacking patterns of coarse- and fine-grained sediment. In our model, overspilling, stratified turbidity currents build levees of interbedded sandy silt and clayey silt that shows a fining-upward trend. We have also provided a model for the evolution of the channel system at GC 955 based on our sedimentologic analyses whereby an increase in R causes a decrease in net-to-gross as the levees grow. The lower bounding unit is composed of thin-bedded, hydrate-bearing sandy silt. The upper bounding unit is composed of low net-to-gross, thin-bedded sandy silt that may contain hydrate. The scale of vertical reservoir heterogeneity that is observed here is impossible to capture in seismic and log data because of the discrepancy in vertical resolution between seismic, log, and core data. Interbedded hydrate-rich sandy silts range in thickness from less than 1 cm to nearly 100 cm, and such heterogeneity may be inherent in many deep-water levee reservoirs.
REFERENCES CITED
Beaubouef, R., 2004, Deep-water leveed-channel complexes of the Cerro Toro Formation, Upper Cretaceous, southern Chile: AAPG Bulletin, v. 88, no. 11, p. 1471–1500, doi:10.1306/06210403130.
Boswell, R., T. S. Collett, M. Frye, W. Shedd, D. R. McConnell, and D. Shelander, 2012a, Subsurface gas hydrates in the northern Gulf of Mexico: Marine and Petroleum Geology, v. 34, no. 1, p. 4–30, doi:10.1016/j.marpetgeo.2011.10.003.
Boswell, R., M. Frye, D. Shelander, W. Shedd, D. R. McConnell, and A. Cook, 2012b, Architecture of gas-hydrate-bearing sands from Walker Ridge 313, Green Canyon 955, and Alaminos Canyon 21: Northern deepwater Gulf of Mexico: Marine and Petroleum Geology, v. 34, no. 1, p. 134–149, doi:10.1016/j.marpetgeo.2011.08.010.
Boswell, R., K. Yamamoto, S.-R. Lee, T. Collett, P. Kumar, and S. Dallimore, 2014, Methane hydrates, in Letcher, T. M., ed., Future energy, 2nd ed., Waltham, Massachusetts, Elsevier, p. 159–178, doi:10.1016/B978-0-08-099424-6.00008-9.
Boswell, R., J. Yoneda, and W. F. Waite, 2019, India National Gas Hydrate Program Expedition 02 summary of scientific results: Evaluation of natural gas-hydrate-bearing pressure cores: Marine and Petroleum Geology, v. 108, p. 143–153, doi:10.1016/j.marpetgeo.2018.10.020.
Browne, G. H., and R. M. Slatt, 1997, Thin-bedded slope fan (channel-levee) deposits from New Zealand: An outcrop analog for reservoirs in the Gulf of Mexico: GCAGS Transactions, v. 47, p. 75–86.
Chand, S., T. A. Minshull, D. Gei, and J. M. Carcione, 2004, Elastic velocity models for gas-hydrate-bearing sediments—A comparison: Geophysical Journal International, v. 159, no. 2, p. 573–590, doi:10.1111/j.1365-246X.2004.02387.x.
Clemenceau, G. R., 1995, Ram/Powell Field: Viosca Knoll Block 912, deepwater Gulf of Mexico, in R. D. J. Winn and J. M. Armentrout, eds., Turbidites and associated deep-water facies: Tulsa, Oklahoma, SEPM Core Workshop 20, p. 95–129, doi:10.2110/cor.95.20.0095.
Clemenceau, G. R., J. Colbert, and D. Edens, 2000, Production results from levee-overbank turbidite sands at Ram/Powell Field, deepwater Gulf of Mexico, in Weimer, P., ed., Deep-water reservoirs of the world: Tulsa, Oklahoma, SEPM Society for Sedimentary Geology, p. 241–251.
Collett, T. S., and R. Boswell, 2012, Resource and hazard implications of gas hydrates in the Northern Gulf of Mexico: Results of the 2009 Joint Industry Project Leg II Drilling Expedition: Marine and Petroleum Geology, v. 34, no. 1, p. 1–3, doi:10.1016/j.marpetgeo.2012.01.002.
Collett, T. S., R. Boswell, J. R. Cochran, P. Kumar, M. Lall, A. Mazumdar, and M. V. Ramana, et al., 2014, Geologic implications of gas hydrates in the offshore of India: Results of the National Gas Hydrate Program Expedition 01: Marine and Petroleum Geology, v. 58, p. 3–28, doi:10.1016/j.marpetgeo.2014.07.021.
Collett, T. S., M. Riedel, J. R. Cochran, R. Boswell, P. Kumar, and A. Sathe, 2008, Indian continental margin gas hydrate prospects: Results of the Indian National Gas Hydrate Program (NGHP) expedition 01: Proceedings of the 6th International Conference on Gas Hydrates, Vancouver, British Columbia, Canada, July 6–10, 2008, 10 p.
Covault, J. A., and S. A. Graham, 2010, Submarine fans at all sea-level stands: Tectono-morphologic and climatic controls on terrigenous sediment delivery to the deep sea: Geology, v. 38, no. 10, p. 939–942, doi:10.1130/G31081.1.
Cronin, B. T., A. Hurst, H. Celik, and I. Türkmen, 2000, Superb exposure of a channel, levee and overbank complex in an ancient deep-water slope environment: Sedimentary Geology, v. 132, no. 3–4, p. 205–216, doi:10.1016/S0037-0738(00)00008-7.
Deptuck, M. E., G. S. Steffens, M. Barton, and C. Pirmez, 2003, Architecture and evolution of upper fan channel-belts on the Niger Delta slope and in the Arabian Sea: Marine and Petroleum Geology, v. 20, no. 6–8, p. 649–676, doi:10.1016/j.marpetgeo.2003.01.004.
Di Stefano, C., V. Ferro, and S. Mirabile, 2010, Comparison between grain-size analyses using laser diffraction and sedimentation methods: Biosystems Engineering, v. 106, no. 2, p. 205–215, doi:10.1016/j.biosystemseng.2010.03.013.
Enunwa, C., J. L. Razzano, III, A. Ramgulam, P. B. Flemings, T. Ertekin, and Z. T. Karpyn, 2005, Tahoe Field case study—Understanding reservoir compartmentalization in a channel-levee system: Gulf Coast Association of Geologic Societies Transactions, v. 55, p. 152–162.
Ferro, V., and S. Mirabile, 2009, Comparing particle size distribution analysis by sedimentation and laser diffraction method: Journal of Agricultural Engineering, v. 40, no. 2, p. 35–43, doi:10.4081/jae.2009.2.35.
Figueiredo, J. J., D. M. Hodgson, S. S. Flint, and J. P. Kavanagh, 2010, Depositional environments and sequence stratigraphy of an exhumed Permian mudstone-dominated submarine slope succession, Karoo Basin, South Africa: Journal of Sedimentary Research, v. 80, no. 1, p. 97–118, doi:10.2110/jsr.2010.002.
Flemings, P. B., R. Boswell, T. S. Collett, A. E. Cook, D. Divins, M. Frye, G. Guerin, D. S. Goldberg, A. Malinverno, and K. Meazell, 2017, GOM2: Prospecting, drilling and sampling coarse-grained hydrate reservoirs in the deepwater Gulf of Mexico: Proceedings of the 9th International Conference on Gas Hydrates, Denver, Colorado, June 25–30, 2017, 10 p.
Flemings, P. B., S. C. Phillips, R. Boswell, T. S. Collett, A. E. Cook, T. Dong, and M. Frye, et al., 2020, Pressure coring a Gulf of Mexico deep-water turbidite gas hydrate reservoir: Initial results from The University of Texas-Gulf of Mexico 2-1 (UT-GOM2-1) Hydrate Pressure Coring Expedition: AAPG Bulletin, v. 104, no. 9, p. 1847–1876, doi:10.1306/01062019165.
Flemings, P. B., S. C. Phillips, T. Collett, A. Cook, and R. Boswell, and, ; the UT-GOM2-1 Expedition. Scientists, 2018, Expedition summary, UT-GOM2-1 hydrate pressure coring expedition report, Austin, TX: Austin, Texas, University of Texas Institute for Geophysics, accessed July 9, 2020, https://ig.utexas.edu/energy/genesisof-methane-hydrate-in-coarse-grained-systems/expedition-ut-gom2-1/reports/.
Folk, R. L., 1980, Petrology of sedimentary rocks: Austin, Texas, Hemphill Publishing Company, 184 p.
Frye, M., W. Shedd, and R. Boswell, 2012, Gas hydrate resource potential in the Terrebonne Basin, northern Gulf of Mexico: Marine and Petroleum Geology, v. 34, no. 1, p. 150–168, doi:10.1016/j.marpetgeo.2011.08.001.
Fujii, T., T. Saeki, T. Kobayashi, T. Inamori, M. Hayashi, O. Takano, T. Takayama, T. Kawasaki, S. Nagakubo, and M. Nakamizu, 2008, Resource assessment of methane hydrate in the eastern Nankai Trough, Japan: Offshore Technology Conference, Houston, Texas, May 5–8, 2008, OTC-19310-MS, 15 p., doi:10.4043/19310-MS.
Gardner, M. H., J. M. Borer, J. J. Melick, N. Mavilla, M. Dechesne, and R. N. Wagerle, 2003, Stratigraphic process-response model for submarine channels and related features from studies of Permian Brushy Canyon outcrops, West Texas: Marine and Petroleum Geology, v. 20, no. 6–8, p. 757–787, doi:10.1016/j.marpetgeo.2003.07.004.
Germaine, J. T., and A. V. Germaine, 2009, Geotechnical laboratory measurements for engineers: Hoboken, New Jersey, John Wiley & Sons, 351 p., doi: 10.1002/9780470548790.
Guerin, G., A. Cook, S. Mrozewski, T. Collett, and R. Boswell, 2010, Gulf of Mexico Gas Hydrate Joint Industry Project Leg II: Green Canyon 955 LWD operations and results: Washington, DC, Department of Energy, accessed July 9, 2020, https://netl.doe.gov/sites/default/files/netl-file/GC955SiteSum%5B1%5D.pdf.
Gupta, L. P., W. Tanikawa, Y. Hamada, T. Hirose, N. Ahagon, T. Sugihara, N. Abe, S. Nomura, Y. Masaki, and H. Y. Wu, 2018, Examination of gas hydrate-bearing deep ocean sediments by x-ray computed tomography and verification of physical property measurements of sediments: Marine and Petroleum Geology, v. 108, p. 239–248.
Hackbarth, C. J., and R. D. Shew, 1994, Morphology and stratigraphy of a Mid-Pleistocene turbidite leveed channel from seismic, core and log data, northeastern Gulf of Mexico, in P. Weimer, A. H. Bouma, and B. F. Perkins, eds., Submarine fans and turbidite systems—Sequence stratigraphy, reservoir architecture and production characteristics Gulf of Mexico and international: Tulsa, Oklahoma, SEPM Society for Sedimentary Geology, v. 15, p. 127–133, doi:10.5724/gcs.94.15.0137.
Hagedorn, A. R., and R. J. Blackwell, 1972, Summary of experience with pressure coring: Fall Meeting of the Society of Petroleum Engineers of AIME, San Antonio, Texas, October 8–11, 1972, SPE-3962-MS, 10 p., doi: 10.2118/3962-MS.
Hansen, L., R. Callow, I. Kane, and B. Kneller, 2017a, Differentiating submarine channel-related thin-bedded turbidite facies: Outcrop examples from the Rosario Formation, Mexico: Sedimentary Geology, v. 358, p. 19–34, doi:10.1016/j.sedgeo.2017.06.009.
Hansen, L., M. Janocko, I. Kane, and B. Kneller, 2017b, Submarine channel evolution, terrace development, and preservation of intra-channel thin-bedded turbidites: Mahin and Avon channels, offshore Nigeria: Marine Geology, v. 383, p. 146–167, doi:10.1016/j.margeo.2016.11.011.
Hansen, L. A. S., R. H. T. Callow, I. A. Kane, F. Gamberi, M. Rovere, B. T. Cronin, and B. C. Kneller, 2015, Genesis and character of thin-bedded turbidites associated with submarine channels: Marine and Petroleum Geology, v. 67, p. 852–879, doi:10.1016/j.marpetgeo.2015.06.007.
Heggland, R., 2004, Definition of geohazards in exploration 3-D seismic data using attributes and neural-network analysis: AAPG Bulletin, v. 88, no. 6, p. 857–868, doi:10.1306/02040404019.
Hiscott, R. N., F. R. Hall, and C. Pirmez, 1997, Turbidity-current overspill from the Amazon Channel: Texture of the silt/sand load, paleoflow from anisotropy of magnetic susceptibility, and implications for flow processes: Proceedings of the Ocean Drilling Program: Scientific Results, v. 155, p. 53–78.
Hodgson, D. M., C. N. Di Celma, R. L. Brunt, and S. S. Flint, 2011, Submarine slope degradation and aggradation and the stratigraphic evolution of channel–levee systems: Journal of the Geological Society, v. 168, no. 3, p. 625–628, doi:10.1144/0016-76492010-177.
Holland, M., P. Schultheiss, and J. Roberts, 2019, Gas hydrate saturation and morphology from analysis of pressure cores acquired in the Bay of Bengal during expedition NGHP-02, offshore India: Marine and Petroleum Geology, v. 108, p. 407–423, doi:10.1016/j.marpetgeo.2018.07.018.
Holland, M., P. Schultheiss, J. Roberts, and M. Druce, 2008, Observed gas hydrate morphologies in marine sediments: 6th International Conference on Gas Hydrates, Vancouver, British Columbia, Canada, July 6–10, 2008, p. 6–10.
Hutchinson, D., R. Boswell, T. Collett, J. C. Dai, O. Dugan, M. Frye, D. Mcconnell, K. Rose, W. Shedd, D. Shelander, and W. Wood, 2009, Gulf of Mexico Gas Hydrate Joint Industry Project Leg II: Green Canyon 955 site selection: Washington, DC, Department of Energy, accessed July 9, 2020, https://netl.doe.gov/sites/default/files/netl-file/GC955SiteSelect%5B1%5D.pdf.
Hutchinson, D. R., D. Shelander, J. Dai, D. McConnell, W. Shedd, M. Frye, C. Ruppel, R. Boswell, E. Jones, and T. Collett, 2008, Site selection for DOE/JIP gas hydrate drilling in the northern Gulf of Mexico: International Conference on Gas Hydrates, Vancouver, British Columbia, Canada, July 6–10, 2008, 12 p., doi:10.14288/1.0041022.
Inada, N., and K. Yamamoto, 2015, Data report: Hybrid pressure coring system tool review and summary of recovery result from gas-hydrate related coring in the Nankai Project: Marine and Petroleum Geology, v. 66, p. 323–345, doi:10.1016/j.marpetgeo.2015.02.023.
Ito, T., Y. Komatsu, T. Fujii, K. Suzuki, K. Egawa, Y. Nakatsuka, and Y. Konno, et al., 2015, Lithological features of hydrate-bearing sediments and their relationship with gas hydrate saturation in the eastern Nankai Trough, Japan: Marine and Petroleum Geology, v. 66, p. 368–378, doi:10.1016/j.marpetgeo.2015.02.022.
Ito, T., Y. Komatsu, T. Fujii, K. Suzuki, K. Egawa, Y. Nakatsuka, and Y. Konno, et al., 2018, Corrigendum to “Lithological features of hydrate-bearing sediments and their relationship with gas hydrate saturation in the eastern Nankai Trough, Japan” [Marine and Petroleum Geology, 66 (2015) 368–378]: Marine and Petroleum Geology, v. 91, p. 661, doi:10.1016/j.marpetgeo.2018.02.023.
Jobe, Z. R., 2010, Multi-scale architectural evolution and flow property characterization of channelized turbidite systems, Doctoral dissertation, Stanford University, Stanford, California, 218 p.
Jobe, Z. R., D. R. Lowe, and W. R. Morris, 2012, Climbing‐ripple successions in turbidite systems: Depositional environments, sedimentation rates and accumulation times: Sedimentology, v. 59, no. 3, p. 867–898, doi:10.1111/j.1365-3091.2011.01283.x.
Kane, I. A., and D. M. Hodgson, 2011, Sedimentological criteria to differentiate submarine channel levee subenvironments: Exhumed examples from the Rosario Fm. (Upper Cretaceous) of Baja California, Mexico, and the Fort Brown Fm. (Permian), Karoo basin, S. Africa: Marine and Petroleum Geology, v. 28, no. 3, p. 807–823, doi:10.1016/j.marpetgeo.2010.05.009.
Kane, I. A., D. T. McGee, and Z. R. Jobe, 2012, Halokinetic effects on submarine channel equilibrium profiles and implications for facies architecture: Conceptual model illustrated with a case study from Magnolia Field, Gulf of Mexico: Geological Society, London, Special Publications 2012, v. 363, p. 289–302, doi:10.1144/SP363.13.
Kendrick, J. W., 2000, Turbidite reservoir architecture in the northern Gulf of Mexico deepwater: Insights from the development of Auger, Tahoe, and Ram/Powell Fields, in Weimer, P., ed., Deep-water reservoirs of the world: Tulsa, Oklahoma, SEPM Society for Sedimentary Geology, p. 450–468, doi:10.5724/gcs.00.15.0450.
Kvenvolden, K. A., 1988, Methane hydrate—A major reservoir of carbon in the shallow geosphere?: Chemical Geology, v. 71, no. 1–3, p. 41–51, doi:10.1016/0009-2541(88)90104-0.
Lee, M. W., and T. S. Collett, 2012, Pore- and fracture-filling gas hydrate reservoirs in the Gulf of Mexico Gas Hydrate Joint Industry Project Leg II Green Canyon 955 H well: Marine and Petroleum Geology, v. 34, no. 1, p. 62–71, doi:10.1016/j.marpetgeo.2011.08.002.
McCarthy, P., J. Brand, B. Paradiso, J. Ezekwe, N. Wiltgen, A. Bridge, R. Willingham, and M. Bogaards, 2005, Using geostatistical inversion of seismic and borehole data to generate reservoir models for flow simulations of Magnolia Field, deepwater Gulf of Mexico, Society of Exploration Geophysicists Technical Program expanded abstracts: Houston, Texas, November 6–11, 2005, SEG-2005-1351, 5 p.
McConnell, D. R., 2000, Optimizing deepwater well locations to reduce the risk of shallow-water-flow using high-resolution 2D and 3D seismic data: Proceedings of Offshore Technology Conference, Houston, Texas, May 1–4, 2000, OTC-11973, 11 p., doi:10.4043/11973-MS.
McConnell, D. R., T. S. Collett, R. Boswell, M. Frye, W. W. Shedd, R. S. Dufrene, and P. D. Godfriaux, et al., 2010, Gulf of Mexico Gas Hydrate Joint Industry Project Leg II: Initial results from the Green Canyon 955 site: Proceedings of Offshore Technology Conference, Houston, Texas, May 3–6, 2010, OTC-20801, 14 p., doi:10.4043/20801-MS.
Meldahl, P., R. Heggland, B. Bril, and P. de Groot, 2001, Identifying faults and gas chimneys using multiattributes and neural networks: Leading Edge, v. 20, no. 5, p. 474–482, doi:10.1190/1.1438976.
Morris, E. A., D. M. Hodgson, R. L. Brunt, and S. S. Flint, 2014, Origin, evolution and anatomy of silt‐prone submarine external levées: Sedimentology, v. 61, no. 6, p. 1734–1763, doi:10.1111/sed.12114.
Noguchi, S., N. Shimoda, O. Takano, N. Oikawa, T. Inamori, T. Saeki, and T. Fujii, 2011, 3-D internal architecture of methane hydrate-bearing turbidite channels in the eastern Nankai Trough, Japan: Marine and Petroleum Geology, v. 28, no. 10, p. 1817–1828, doi:10.1016/j.marpetgeo.2011.02.004.
Oshima, M., K. Suzuki, J. Yoneda, A. Kato, M. Kida, Y. Konno, M. Muraoka, Y. Jin, J. Nagao, and N. Tenma, 2019, Lithological properties of natural gas hydrate–bearing sediments in pressure-cores recovered from the Krishna–Godavari Basin: Marine and Petroleum Geology, v. 108, p. 439–470, doi:10.1016/j.marpetgeo.2019.01.015.
Peakall, J., B. McCaffrey, and B. Kneller, 2000, A process model for the evolution, morphology, and architecture of sinuous submarine channels: Journal of Sedimentary Research, v. 70, no. 3, p. 434–448, doi:10.1306/2DC4091C-0E47-11D7-8643000102C1865D.
Pettijohn, F. J., P. E. Potter, and R. Siever, 2012, Sand and sandstone: New York, Springer Science & Business Media, 553 p.
Phillips, S. C., P. B. Flemings, M. E. Holland, P. J. Schultheiss, W. F. Waite, J. Jang, E. G. Petrou, and H. Hammon, 2020, High concentration methane hydrate in a silt reservoir from the deep-water Gulf of Mexico: AAPG Bulletin, v. 104, no. 9, p. 1971–1995, doi:10.1306/01062018280.
Pickering, K., J. Coleman, M. Cremer, L. Droz, B. Kohl, W. Normark, S. O’Connell, D. Stow, and A. Meyer-Wright, 1986, A high sinuosity, laterally migrating submarine fan channel-levee-overbank: Results from DSDP Leg 96 on the Mississippi Fan, Gulf of Mexico: Marine and Petroleum Geology, v. 3, no. 1, p. 3–18, doi:10.1016/0264-8172(86)90052-8.
Piper, D. J., and M. Deptuck, 1997, Fined-grained turbidites of the Amazon Fan: Facies characterization and interpretation: Proceedings of the Ocean Drilling Program: Scientific Results, v. 155, p. 79–108.
Piper, D. J., and W. R. Normark, 2001, Sandy fans—From Amazon to Hueneme and beyond: AAPG Bulletin, v. 85, no. 8, p. 1407–1438.
Portnov, A., A. E. Cook, M. Heidari, D. E. Sawyer, M. Santra, and M. Nikolinakou, 2020, Salt-driven evolution of a gas hydrate reservoir in Green Canyon, Gulf of Mexico: AAPG Bulletin, v. 104, no. 9, p. 1903–1919, doi:10.1306/10151818125.
Prather, B. E., C. Pirmez, C. D. Winker, M. Deptuck, and D. Mohrig, 2012, Stratigraphy of linked intraslope basins: Brazos-Trinity System western Gulf of Mexico: Application of the principles of seismic geomorphology to continental-slope and base-of-slope systems: Case studies from seafloor and near-seafloor analogues: Tulsa, Oklahoma, SEPM Special Publication 99, p. 83–109.
Ruppel, C., R. Boswell, and E. Jones, 2008, Scientific results from Gulf of Mexico Gas Hydrates Joint Industry Project Leg 1 drilling: Introduction and overview: Marine and Petroleum Geology, v. 25, no. 9, p. 819–829, doi:10.1016/j.marpetgeo.2008.02.007.
Ryu, B.-J., T. S. Collett, M. Riedel, G. Y. Kim, J.-H. Chun, J.-J. Bahk, J. Y. Lee, J.-H. Kim, and D.-G. Yoo, 2013, Scientific results of the Second Gas Hydrate Drilling Expedition in the Ulleung Basin (UBGH2): Marine and Petroleum Geology, v. 47, p. 1–20, doi:10.1016/j.marpetgeo.2013.07.007.
Santra, M., P. B. Flemings, E. Scott, and P. K. Meazell, 2020, Evolution of gas hydrate–bearing deep-water channel-levee system in abyssal Gulf of Mexico: Levee growth and deformation: AAPG Bulletin, v. 104, no. 9, p. 1921–1944, doi:10.1306/04251918177.
Sawyer, D. E., P. B. Flemings, R. C. Shipp, and C. D. Winker, 2007, Seismic geomorphology, lithology, and evolution of the late Pleistocene Mars-Ursa turbidite region, Mississippi Canyon area, northern Gulf of Mexico: AAPG Bulletin, v. 91, no. 2, p. 215–234, doi:10.1306/08290605190.
Sawyer, D. E., R. Jacoby, P. Flemings, and J. T. Germaine, 2009, Data report: Particle size analysis of sediments in the Ursa Basin, IODP Expedition 308 Sites U1324 and U1322, northern Gulf of Mexico: Proceedings of the Integrated Ocean Drilling Program, v. 308, 20 p., doi:10.2204/iodp.proc.308.205.2008.
Schultheiss, P., M. Holland, J. Roberts, Q. Huggett, M. Druce, and P. Fox, 2011, PCATS: Pressure core analysis and transfer system: Proceedings of the 7th International Conference on Gas Hydrates, Edinburgh, United Kingdom, July, 17–21, 2011, p. 17–21.
Shepard, F. P., 1954, Nomenclature based on sand-silt-clay ratios: Journal of Sedimentary Research, v. 24, p. 151–158.
Shukla, K., T. Collett, P. Kumar, U. Yadav, R. Boswell, M. Frye, M. Riedel, I. Kaur, and K. Vishwanath, 2019, National Gas Hydrate Program expedition 02: Identification of gas hydrate prospects in the Krishna-Godavari Basin, offshore India: Marine and Petroleum Geology, v. 108, p. 167–184, doi:10.1016/j.marpetgeo.2018.11.013.
Sloan, E. D., 2003, Fundamental principles and applications of natural gas hydrates: Nature, v. 426, no. 6964, p. 353–359, doi:10.1038/nature02135.
Stow, D. A. V., and A. J. Bowen, 1978, Origin of lamination in deep sea, fine-grained sediments: Nature, v. 274, no. 5669, p. 324–328, doi:10.1038/274324a0.
Stow, D. A. V., and A. J. Bowen, 1980, A physical model for the transport and sorting of fine‐grained sediment by turbidity currents: Sedimentology, v. 27, no. 1, p. 31–46, doi:10.1111/j.1365-3091.1980.tb01156.x.
Straub, K. M., and D. Mohrig, 2008, Quantifying the morphology and growth of levees in aggrading submarine channels: Journal of Geophysical Research. Earth Surface, v. 113, p. 1–20.
Straub, K. M., D. Mohrig, J. Buttles, B. McElroy, and C. Pirmez, 2011, Quantifying the influence of channel sinuosity on the depositional mechanics of channelized turbidity currents: A laboratory study: Marine and Petroleum Geology, v. 28, no. 3, p. 744–760, doi:10.1016/j.marpetgeo.2010.05.014.
Tamaki, M., T. Fujii, and K. Suzuki, 2017, Characterization and prediction of the gas hydrate reservoir at the second offshore gas production test site in the eastern Nankai trough, Japan: Energies, v. 10, no. 10, 1678, 13 p., doi:10.3390/en10101678.
Thomas, C., S. C. Phillips, P. B. Flemings, M. Santra, H. Hammon, T. S. Collett, and A. E. Cook, et al., 2020, Pressure-coring operations during The University of Texas-Gulf of Mexico 2-1 (UT-GOM2-1) Hydrate Pressure Coring Expedition in Green Canyon Block 955, northern Gulf of Mexico: AAPG Bulletin, v. 104, no. 9, p. 1877–1901, doi:10.1306/02262019036.
Tréhu, A. M., G. Bohrmann, M. E. Torres, F. R. Rack, N. L. Bangs, S. R. Barr, and W. S. Borowski, et al., 2005, Proceedings of the Ocean Drilling Program; scientific results; drilling gas hydrates on Hydrate Ridge, Cascadia continental margin; covering Leg 204 of the cruises of the drilling vessel JOIDES Resolution; Victoria, British Columbia, Canada, to Victoria, British Columbia, Canada; Sites 1244-1252; 7 July-2 September, 2002: College Station, Texas, Texas A&M University.
Walker, R. G., 1978, Deep-water sandstone facies and ancient submarine fans: Models for exploration for stratigraphic traps: AAPG Bulletin, v. 62, no. 6, p. 932–966.
Weimer, P., 1990, Sequence stratigraphy, facies geometries, and depositional history of the Mississippi Fan, Gulf of Mexico 1: AAPG Bulletin, v. 74, no. 4, p. 425–453.
Weissenburger, K., and T. Borbas, 2004, Fluid properties, phase and compartmentalization: Magnolia field case study, deepwater Gulf of Mexico, USA: Geological Society, London, Special Publications 2004, v. 237, p. 231–255, doi:10.1144/GSL.SP.2004.237.01.14.
Wen, B., A. Aydin, and N. S. Duzgoren-Aydin, 2002, A comparative study of particle size analyses by sieve-hydrometer and laser diffraction methods: Geotechnical Testing Journal, v. 25, p. 434–442.
Wentworth, C. K., 1922, A scale of grade and class terms for clastic sediments: Journal of Geology, v. 30, no. 5, p. 377–392, doi:10.1086/622910.
Winters, W. J., W. F. Waite, D. Mason, L. Gilbert, and I. Pecher, 2007, Methane gas hydrate effect on sediment acoustic and strength properties: Journal of Petroleum Science Engineering, v. 56, no. 1–3, p. 127–135, doi:10.1016/j.petrol.2006.02.003.
ACKNOWLEDGMENTS
This material is based upon work supported by the US Department of Energy under Award Number DE-FE0023919. This article was prepared as an account of work sponsored by an agency of the United States Government. Neither the United States Government nor any agency thereof, nor any of their employees, makes any warranty, expressed or implied, or assumes any legal liability or responsibility for the accuracy, completeness, or usefulness of any information, apparatus, product, or process disclosed or represents that its use would not infringe on privately owned rights. Reference herein to any specific commercial product, process, or service by trade name, trademark, manufacturer, or otherwise does not necessarily constitute or imply its endorsement, recommendation, or favoring by the United States Government or any agency thereof. The views and opinions of the authors expressed herein do not necessarily state or reflect those of the United States Government or any agency thereof.